
Cash on cash return is defined as the annual pre-tax cash flow a property generates divided by the total cash you invested, expressed as a percentage. This metric cuts through the noise of theoretical gains and tells you exactly what your money is earning right now. Unlike appreciation or equity buildup, the cash flow return is grounded in real dollars hitting your account. Industry standards place a good target between 8% and 12% for buy-and-hold rentals, though 2026 mortgage rates near 6.3%–6.5% are pushing many investors toward the lower end of that range. Deal-zilla's deal analysis tools are built around this kind of real-world metric, because profitability decisions deserve real data.
How to calculate cash on cash return
The formula is straightforward: (Annual Pre-Tax Cash Flow / Total Cash Invested) × 100. Getting the inputs right is where most investors make mistakes.
Annual pre-tax cash flow equals your net operating income (NOI) minus your annual mortgage payments, including both principal and interest. NOI itself is gross rental income minus operating expenses like property taxes, insurance, maintenance, and property management fees. Mortgage payments are not an operating expense, so they stay out of NOI and get subtracted separately.
Total cash invested includes three components:
- Down payment
- Closing costs
- Initial repairs or renovations before the property is rent-ready
Here is a concrete example. You buy a rental property and put $50,000 down. Closing costs run $4,000, and you spend $6,000 on repairs before the first tenant moves in. Your total cash invested is $60,000. The property generates $18,000 in annual gross rent. After $5,000 in operating expenses, your NOI is $13,000. Your annual mortgage payments total $9,000. Annual pre-tax cash flow equals $13,000 minus $9,000, which is $4,000. Your annual cash return is ($4,000 / $60,000) × 100, or 6.67%.
A result like 9.235% on a commercial property, for example, signals a solid pre-tax return on the cash you put to work. That number is immediately comparable across deals, which is the metric's greatest strength.

One distinction worth understanding: levered cash on cash return uses actual mortgage-adjusted cash flow, as shown above. Unlevered cash on cash return ignores financing entirely and treats the property as if you paid all cash. Levered figures are more useful for most investors because financing is a real cost that shapes real returns.
Pro Tip: Use the same NOI definition every time you run this calculation. Mixing definitions across deals, such as including mortgage interest in one NOI calculation but not another, will make your comparisons meaningless.
What ranges of cash on cash return are considered good in 2026?
A good cash on cash return for buy-and-hold rental properties falls between 8% and 12%. That range reflects a property producing meaningful annual cash flow relative to the cash you committed at closing.
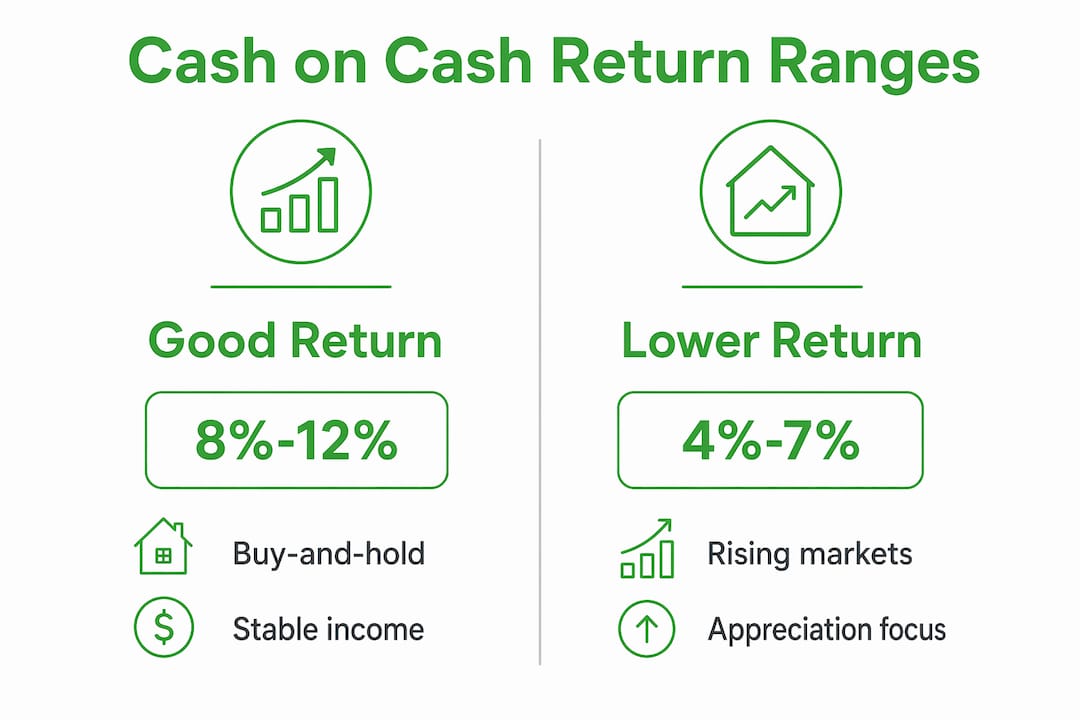
The 2026 rate environment complicates that benchmark. Mortgage rates near 6.3%–6.5% are compressing returns across most markets. Higher debt service costs eat directly into annual pre-tax cash flow, which means properties that would have cleared 10% a few years ago may now land at 6% or 7% with identical rent and expenses.
Several factors determine what counts as acceptable in your specific market:
- Market type: High-cost, high-appreciation markets like coastal metros often produce returns in the 4%–7% range. Investors accept lower cash flow in exchange for stronger long-term appreciation.
- Property class: Class A properties in stable neighborhoods typically carry lower yields than Class C properties with higher vacancy risk.
- Financing structure: A larger down payment reduces debt service and lifts the return percentage, but it also increases your total cash invested.
- Local rent growth: Markets with strong rent growth can turn a 6% return today into a 9% return within two or three years as rents rise against a fixed mortgage payment.
A 4%–7% return is not automatically a bad deal. In a market where property values are rising and rents are climbing, that number can represent a sound long-term position. The investment return ratio only tells you about this year's cash earnings.
Pro Tip: Never evaluate a deal on cash on cash return alone. Factor in projected appreciation, tax advantages like depreciation deductions, and your total equity position before passing on a property with a lower annual yield.
How does cash on cash return differ from ROI and cap rate?
These three metrics answer three different questions, and confusing them leads to bad decisions.
Cash on cash return asks: how much annual cash flow am I earning on the cash I put in? It accounts for financing costs and focuses entirely on pre-tax cash flow for the current year. It ignores appreciation, equity buildup, and tax benefits.
Cap rate (capitalization rate) asks: what is this property worth relative to its income, independent of how I finance it? Cap rate equals NOI divided by the purchase price. It strips out financing entirely, which makes it useful for comparing properties across different capital structures. A property with a 7% cap rate in a given market tells you something about that market's pricing, regardless of whether you pay cash or take out a mortgage.
ROI (return on investment) asks: what is my total return over the full holding period? ROI captures appreciation, equity buildup from mortgage paydown, tax benefits, and cash flow together. It is a long-term, comprehensive measure rather than a snapshot.
| Metric | What it measures | Includes financing? | Includes appreciation? |
|---|---|---|---|
| Cash on cash return | Annual pre-tax cash flow vs. cash invested | Yes | No |
| Cap rate | NOI vs. purchase price | No | No |
| ROI | Total return over holding period | Yes | Yes |
The cash on cash analysis is often called the "most honest" metric because it reflects actual cash earnings with no theoretical components. That honesty is also its limitation. A property with a 5% cash on cash return and 8% annual appreciation is outperforming a property with a 10% cash on cash return and zero appreciation, but the first metric alone would not tell you that.
Pro Tip: Run all three metrics on every deal. Cash on cash return tells you about today. Cap rate tells you about the asset's value. ROI tells you about the full investment horizon. You need all three to make a confident decision.
Practical strategies to improve cash on cash return on your rentals
The formula has two levers: increase annual pre-tax cash flow, or reduce total cash invested. Most improvement strategies target one or both.
Increase net operating income. Rent optimization is the fastest path. Research comparable rents in your market before every lease renewal. Even a $75 monthly rent increase on a single-family rental adds $900 to your annual cash flow. On a $60,000 cash investment, that moves your return by 1.5 percentage points. Expense management matters equally. Renegotiating insurance, switching to more efficient property management, and reducing deferred maintenance all protect NOI.
Reduce mortgage costs. Refinancing to a lower rate directly reduces your annual debt service, which increases pre-tax cash flow without touching rent or expenses. Even a 0.5% rate reduction on a $200,000 loan saves roughly $1,000 per year in interest. That improvement flows straight to your cash on cash return.
Control renovation spending before closing. Initial repairs and renovations are part of your total cash invested. Overspending on cosmetic upgrades that do not support higher rents inflates your denominator without improving your numerator. Get contractor bids before you close, not after. Knowing your true renovation cost is part of running an honest real estate cash return analysis.
Choose financing terms deliberately. A 30-year fixed mortgage carries lower monthly payments than a 15-year mortgage, which improves annual cash flow and lifts your cash on cash return in the short term. A 15-year mortgage builds equity faster but compresses current cash flow. Match your financing term to your investment goals, not just the lowest payment.
Manage the property efficiently. Vacancy is the single largest drag on cash flow. A property sitting empty for 60 days loses roughly 16% of its annual gross rent. Efficient property management reduces vacancy, controls maintenance costs, and protects the NOI that drives your return.
Key Takeaways
Cash on cash return is the most direct measure of annual cash earnings on invested capital, but it requires context from cap rate, ROI, and current market conditions to guide sound investment decisions.
| Point | Details |
|---|---|
| Core formula | Divide annual pre-tax cash flow by total cash invested, then multiply by 100. |
| Target return range | An 8%–12% return is the standard benchmark; 4%–7% is acceptable in high-appreciation markets. |
| 2026 rate pressure | Mortgage rates near 6.3%–6.5% are compressing returns and pushing targets toward the lower end. |
| Metric limitations | Cash on cash return excludes appreciation, tax benefits, and equity buildup. Use it alongside cap rate and ROI. |
| Improvement levers | Raise NOI through rent and expense management, reduce debt service, and control upfront renovation costs. |
The honest metric that still needs a partner
Cash on cash return earns its reputation as the most transparent metric in real estate analysis. It does not flatter you with projected appreciation or theoretical equity gains. It tells you what your cash is actually earning this year, and that clarity is genuinely useful.
That said, I have watched investors walk away from excellent deals because the cash on cash return came in at 5% or 6%. In markets with strong rent growth and solid appreciation history, those deals often outperform the 10% cash on cash return properties over a five-year hold. The metric is a snapshot. It captures one frame of a much longer film.
The investors who use it well treat it as a filter, not a verdict. They screen deals quickly with cash on cash return, then dig deeper with cap rate, projected IRR, and a realistic appreciation model before making a final call. A low return number should prompt questions, not automatic rejection. Ask why the return is low. Is it a high purchase price? High debt service? Elevated vacancy? Each answer points to a different fix or a different conclusion.
The other trap I see regularly is investors chasing high cash on cash return numbers in markets with weak fundamentals. A 12% return in a market with declining population and falling rents is not a win. The metric cannot tell you that. Your market research has to.
Use cash on cash return as your first filter and your ongoing performance benchmark. Then build the full picture around it.
— ARX
How Deal-zilla supports your cash on cash analysis
Real estate investors who run numbers manually on spreadsheets often miss inputs that shift their return by several percentage points. Deal-zilla provides a purpose-built platform for deal analysis, including tools for Section 8 investment evaluation, BRRRR calculations, and rent analysis grounded in real HUD data.

When you run a deal through Deal-zilla's analyzer, you get a clear picture of your cash flow metrics before you commit a dollar. The platform pulls real market data so your NOI estimates and rent projections reflect actual conditions, not wishful thinking. For investors evaluating fix-and-flip opportunities or buy-and-hold rentals, that data-driven foundation makes the difference between a confident offer and a costly mistake. Visit Deal-zilla to put your next deal through a real analysis.
FAQ
What is cash on cash return in real estate?
Cash on cash return is the annual pre-tax cash flow a property generates divided by the total cash invested, expressed as a percentage. It measures how efficiently your invested capital produces real cash earnings each year.
What is a good cash on cash return in 2026?
A return between 8% and 12% is the standard benchmark for buy-and-hold rentals. In high-cost or high-appreciation markets, a return of 4%–7% is considered acceptable given the additional upside from property value growth.
How does cash on cash return differ from cap rate?
Cap rate divides NOI by the purchase price and ignores financing entirely. Cash on cash return accounts for your actual mortgage payments, making it a more accurate measure of real-world cash flow for leveraged investors.
Can a low cash on cash return still be a good investment?
Yes. A property with a 5% return in a market with strong appreciation and rising rents can outperform a 10% return property in a stagnant market over a five-year hold. Always evaluate the full investment picture, not just the annual cash yield.
What reduces cash on cash return the most?
High debt service from elevated mortgage rates is the largest single drag on cash on cash return in 2026. Vacancy, deferred maintenance, and overpaying at acquisition also compress returns significantly.