
HUD rate charts are standardized data sets published by the U.S. Department of Housing and Urban Development that display Fair Market Rents, mortgage insurance premiums, and other financial benchmarks critical to affordable housing decisions. Knowing how to read HUD rate charts is the single most important skill for landlords and real estate investors who price Section 8 rentals or underwrite multifamily deals. These charts influence what a housing authority will pay, what a lender will approve, and what a property is actually worth in a subsidized market. Deal-zilla works directly with this data to help investors turn raw HUD figures into real investment decisions.
How to read HUD rate charts: Fair Market Rents explained
Fair Market Rent (FMR) is the 40th percentile gross rent for standard rental units in a given area. That means 40% of units rent for less and 60% rent for more. FMR is the anchor number on every HUD rate chart, and every other figure on the chart connects back to it.
HUD publishes FMRs annually, typically effective october 1, with breakdowns by bedroom count from 0 to 4 bedrooms. For units larger than four bedrooms, HUD adds 15% per additional bedroom beyond four. That formula matters when you own a five or six bedroom rental and need to estimate the maximum voucher payment.

The geographic breakdown is where HUD rate charts get genuinely useful. Each chart covers a specific metropolitan statistical area (MSA), county, or non-metropolitan area. Investors reading these charts need to match the correct geographic unit to their property's location. Using a metro-level FMR for a property in a lower-rent suburb will overstate what the local housing authority will actually pay.
What the bedroom columns tell you
The bedroom columns on a HUD FMR chart run from efficiency (0 bedrooms) through 4 bedrooms. Each column shows the gross rent ceiling for that unit size in that geography. Gross rent includes both the contract rent and a utility allowance. If your tenant pays utilities directly, the housing authority subtracts the utility allowance from the FMR to calculate the actual subsidy.
| Bedroom Size | Represents | Investor Use |
|---|---|---|
| Efficiency (0BR) | Studio units, gross rent ceiling | Single-occupant voucher pricing |
| 1 Bedroom | Standard one-bed gross rent | Most common voucher unit type |
| 2 Bedroom | Family unit baseline | High-demand Section 8 category |
| 3 Bedroom | Larger family units | Higher FMR, stronger cash flow potential |
| 4 Bedroom | Maximum standard FMR column | Adjusted formula applies above this |
Landlords use FMR data to set asking rents that qualify for Section 8 vouchers and to estimate maximum allowable offers when acquiring rental properties. An investor who ignores FMR ceilings risks acquiring a property where the market rent exceeds what any voucher will cover.
What are HUD mortgage insurance premiums and the passbook savings rate?
Two additional figures appear on HUD rate charts and financial guidance documents that directly affect your underwriting: the mortgage insurance premium (MIP) and the passbook savings rate.
Mortgage insurance premiums apply to FHA multifamily loans. For applications filed on or after october 1, 2025, HUD standardized MIP at 0.25% across multifamily programs. That rate reduction lowers annual carrying costs on insured loans and simplifies the underwriting process by eliminating specialized MIP categories that previously applied to different property types.
The passbook savings rate is a figure most landlords overlook until an audit flags it. HUD sets this rate to impute income from tenant assets that do not earn interest. The 2026 passbook rate is 0.40%, effective january 1, 2026. When a tenant holds non-interest-bearing assets above $52,787, you must apply this rate to calculate imputed income for their annual certification.
Asset thresholds matter here. Tenants with net assets above $105,574 become ineligible for Section 8 and public housing programs. Landlords who fail to apply the current passbook rate during tenant certification create compliance discrepancies that surface during HUD audits.
- Apply the 0.40% passbook rate to all non-interest-bearing assets above $52,787
- Imputed income from assets adds to gross annual income for eligibility calculations
- Tenants exceeding $105,574 in net assets lose program eligibility
- The passbook rate must be applied as of its effective date on all certifications
Pro Tip: Update your income certification software every january to reflect the new passbook savings rate. Failing to update the rate in your system causes improper tenant income certifications and triggers compliance issues in HUD-assisted housing programs.
What are Small Area Fair Market Rents and how do they differ?
Small Area Fair Market Rents (SAFMR) are ZIP code-specific rent estimates that replace metro or county-level FMRs with neighborhood-level precision. HUD releases SAFMR data annually alongside standard FMRs, and some Public Housing Authorities (PHAs) are required to use them for voucher payment calculations.
The difference between standard FMR and SAFMR is significant in mixed-market metros. A county-level FMR might show $1,400 for a two-bedroom unit, but a high-demand ZIP code within that county might carry a SAFMR of $1,750. An investor buying in that ZIP code who prices to the county FMR leaves money on the table.
PHAs that adopt SAFMRs do so to better reflect actual neighborhood rents and to give voucher holders more access to higher-opportunity areas. For landlords, this means the payment standard in your specific ZIP code may be higher than the metro average shown on the standard FMR chart.
- Standard FMR: Metro or county-level, broader geographic average
- SAFMR: ZIP code-level, reflects neighborhood-specific rent conditions
- PHA payment standard: Set by the local housing authority, may vary from FMR by up to +/-10%
- Access point: HUD's Open Data portal with interactive geographic maps by state, metro, county, and ZIP code
The practical takeaway is straightforward. Always check whether your local PHA uses standard FMR or SAFMR before setting your asking rent. The wrong baseline costs you real subsidy dollars every month.
How do 2026 HUD multifamily financing rates affect investment decisions?
HUD multifamily loan data belongs on every investor's rate chart reading list. The HUD 223(f) loan program offers fixed-rate financing with terms up to 35 years and favorable loan-to-value ratios for affordable housing acquisitions and refinances. The 2026 MIP standardization at 0.25% reduced annual insurance costs and eliminated the specialized categories that previously complicated underwriting.
Two metrics help investors evaluate whether HUD loan terms align with the rent data on their charts.
- Capitalization rate: Divide net operating income by property value. This tells you what the market says the property is worth based on income.
- Mortgage constant: The annual debt service divided by the loan amount. This tells you what the loan costs per dollar borrowed.
- The critical comparison: A cap rate below the mortgage constant signals potential overvaluation or a flawed appraisal, which affects loan sizing and investment risk.
- Debt service coverage ratio (DSCR): HUD requires sufficient DSCR for 223(f) loan approval. FMR data directly informs projected rental income, which feeds into DSCR calculations.
| Metric | What it measures | Connection to HUD rate charts |
|---|---|---|
| Capitalization rate | Income yield on property value | Driven by FMR-based rental income projections |
| Mortgage constant | Annual loan cost per dollar borrowed | Compared against cap rate for risk assessment |
| DSCR | Income coverage of debt payments | FMR sets the income ceiling for voucher units |
| MIP (0.25%) | Annual insurance cost on FHA loan | Reduces operating costs, improves cash flow |
Pro Tip: Access HUD User datasets in late summer, before official PHA announcements, to anticipate FMR changes. Earlier access lets you adjust rental pricing and financing models before competitors do.
HUD updates loan insurance premiums and FMR data on different schedules. Investors who treat these as a single annual update miss mid-cycle changes that affect deal underwriting. Monitoring both independently is standard practice for serious affordable housing investors.
Step-by-step guide to accessing and applying HUD rate chart data
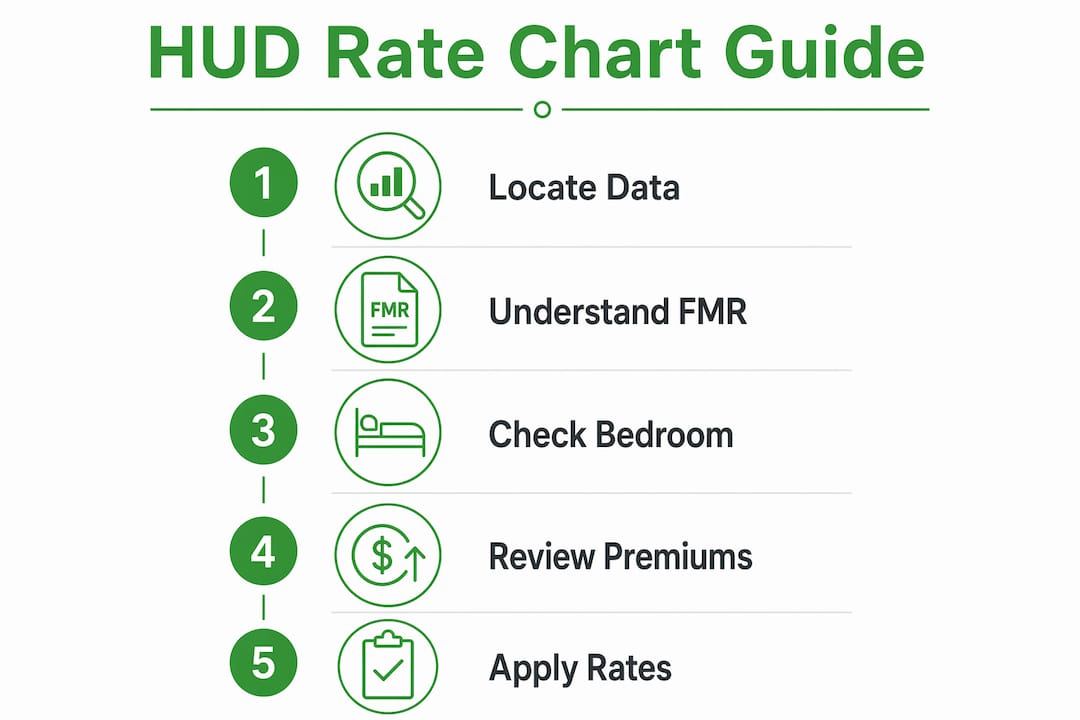
Reading HUD rate charts starts with finding the right data for your market. The process is direct once you know where to look.
Start at HUD's official FMR page at huduser.gov. Select your state, then drill down to your metro area, county, or ZIP code. For SAFMR data, use HUD's Open Data portal, which provides interactive geographic maps that let you visualize rent data overlays across regions.
Once you have the FMR for your property's location and bedroom count, follow these steps to apply it correctly.
- Step 1: Confirm whether your local PHA uses standard FMR or SAFMR for payment standards
- Step 2: Check the PHA's actual payment standard. PHAs may vary payment standards from published FMRs by up to +/-10%, which directly affects your maximum allowable rent
- Step 3: Subtract the utility allowance from the gross FMR to find the net contract rent ceiling
- Step 4: Compare your target asking rent against the net contract rent ceiling to confirm voucher eligibility
- Step 5: Apply the current passbook savings rate (0.40% for 2026) in tenant income certifications for assets above $52,787
- Step 6: For multifamily acquisitions, pull the current MIP rate (0.25%) and run it through your DSCR model alongside projected FMR-based income
Pro Tip: Compare FMR data year over year for your target market. A consistent upward trend in FMR signals a strengthening rental market and supports higher acquisition prices. A flat or declining FMR is a warning sign worth investigating before you close.
Key Takeaways
Reading HUD rate charts accurately requires combining FMR data, local PHA payment standards, and related financial metrics like the passbook savings rate and MIP into a single underwriting framework.
| Point | Details |
|---|---|
| FMR is the baseline | Fair Market Rent sets the gross rent ceiling by bedroom count and geography for all voucher calculations. |
| SAFMR adds precision | ZIP code-level data reflects neighborhood rents more accurately than metro or county averages. |
| Passbook rate affects eligibility | Apply the 0.40% passbook rate to non-interest-bearing assets above $52,787 in every tenant certification. |
| MIP reduction improves cash flow | The 2026 standardized MIP of 0.25% lowers annual insurance costs on FHA multifamily loans. |
| PHA standards vary from FMR | Local housing authorities can set payment standards up to 10% above or below published FMRs. |
What I've learned from watching investors misread HUD charts
Most investors who struggle with HUD rate charts make the same mistake. They read the metro-level FMR, assume it matches what the local PHA will pay, and build their entire rent model on that assumption. Then they close on a property and discover the PHA payment standard is 8% below the published FMR. That gap erases months of projected cash flow.
The second mistake is treating HUD rate charts as a once-a-year task. FMR data drops in late summer for the following fiscal year. MIP rates and passbook savings rates update on their own schedules. An investor who checks HUD data once in january and ignores it until the next lease renewal is flying blind for most of the year.
The third mistake is ignoring the passbook savings rate entirely. Landlords who manage HUD-assisted units often delegate tenant certifications to property managers who use outdated software. When the passbook rate changes and the software does not update, every certification filed after the effective date carries a compliance error. HUD audits catch these discrepancies, and the remediation process is expensive and time-consuming.
The right approach treats HUD rate charts as a living data source. Check FMR data in late summer. Verify your PHA's payment standard directly. Update your certification software every january. Run cap rate versus mortgage constant comparisons every time you underwrite a new deal. None of this is complicated. It just requires discipline and the right tools.
— ARX
Deal-zilla puts HUD rate data to work for your portfolio
Real estate investors who want to act on HUD rate data without spending hours in government portals use Deal-zilla to pull it all together.

Deal-zilla aggregates real Section 8 data, FMR figures, and rental market intelligence into tools built specifically for landlords and investors. The Section 8 Investment Analyzer lets you evaluate deals using current HUD rates, run rent comparisons by market, and stress-test your numbers against PHA payment standards. Whether you are pricing a new rental, underwriting a multifamily acquisition, or running a BRRRR calculation, Deal-zilla gives you the HUD data context to make the call with confidence.
FAQ
What does Fair Market Rent mean on a HUD chart?
Fair Market Rent is the 40th percentile gross rent for standard units in a specific area, published annually by HUD. It sets the ceiling for Section 8 voucher payments by bedroom size and geography.
How often does HUD update its rate charts?
HUD publishes new FMRs annually, typically effective october 1. Mortgage insurance premiums and the passbook savings rate update on separate schedules and require independent monitoring.
What is the HUD passbook savings rate for 2026?
The HUD passbook savings rate is 0.40% effective january 1, 2026. Landlords apply it to impute income from non-interest-bearing tenant assets above $52,787 during annual certifications.
How do Small Area FMRs differ from standard FMRs?
Small Area FMRs provide ZIP code-level rent estimates instead of metro or county averages. Some PHAs use SAFMRs to set payment standards that better reflect actual neighborhood rents.
Can a PHA pay more or less than the published FMR?
Yes. PHAs may set payment standards up to 10% above or below the published FMR. Always confirm your local PHA's actual payment standard before finalizing your rental pricing.