
Analyzing comparable rental properties is the process of evaluating similar nearby rental units to determine a fair and competitive rent price for your property. In real estate, this method is known as a rental comp analysis or "rent comps." 80% of experienced landlords use rental comparables to set correct rent pricing. That number tells you this is not optional tradecraft. It is the standard practice for anyone serious about maximizing occupancy and income without leaving money on the table.
How to analyze comparable rental properties: selecting the right comps
The quality of your rental comp analysis depends entirely on which properties you choose to compare. A bad comp set produces a misleading rent range, and a misleading rent range costs you either vacancy or income.
The five attributes that define a valid comp are:
- Location proximity. Stick to properties within a half mile in dense urban markets or one to two miles in suburban areas. Rent can shift dramatically block by block, especially near transit, schools, or commercial corridors.
- Property type. A single-family home does not comp against a garden-style apartment. Match the structure type: single-family to single-family, condo to condo, duplex unit to duplex unit.
- Bedroom and bathroom count. A two-bedroom, one-bath unit and a two-bedroom, two-bath unit are not the same product. Bathroom count affects achievable rent more than most landlords expect.
- Square footage. Aim for comps within 15–20% of your unit's size. Larger deviations require normalization adjustments, which add complexity and error.
- Recency. Comps from the past 60–90 days are the only reliable baseline for current pricing. Rental markets move fast. A comp from eight months ago reflects a different market.
Amenities also matter more than most investors account for upfront. Off-street parking, pet policies, and in-unit laundry each carry measurable rent premiums that vary by market. Ignoring them produces a skewed baseline.
Pro Tip: When you find a comp that looks too high or too low, call the listing agent or property manager. Asking why it is priced where it is often reveals a condition issue, a recent renovation, or a concession that does not show in the listed rent.

How do you normalize rent prices across different units?
Raw rent numbers from different properties are not directly comparable. A 900-square-foot unit renting for $1,800 and an 1,100-square-foot unit renting for $2,000 look similar on the surface. They are not the same deal.
Step 1: Calculate rent per square foot
Divide the monthly rent by the unit's square footage. The 900-square-foot unit above rents at $2.00 per square foot. The 1,100-square-foot unit rents at $1.82 per square foot. Now you are comparing the same unit of measurement. Price per square foot normalization reduces rent estimate error by 30–40% compared to using raw asking rents. That is a significant accuracy gain for a simple calculation.
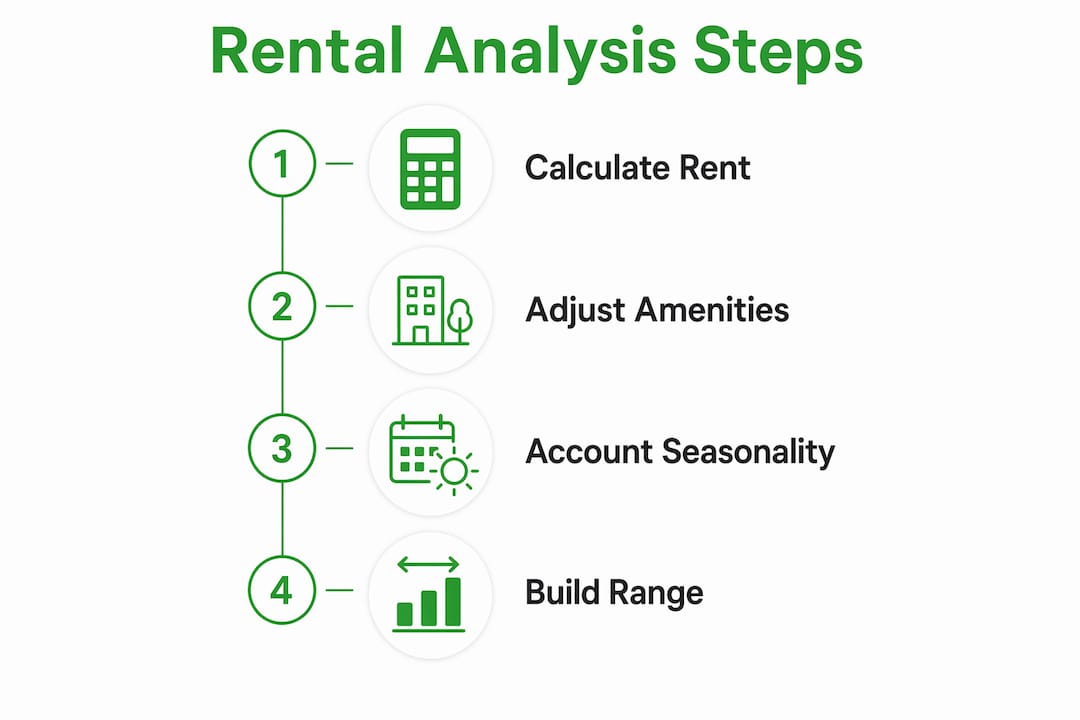
Step 2: Adjust for amenity differences
Assign a dollar value to each amenity difference between your unit and each comp. In-unit washer/dryer adds $75–$150 per month in most markets. Covered parking typically adds $50–$100. If your unit has in-unit laundry and the comp does not, subtract that premium from the comp's rent before comparing. If the comp allows pets and yours does not, adjust accordingly.
Step 3: Account for seasonal trends
Rental demand peaks in late spring and summer in most U.S. markets. A comp listed in july may carry a seasonal premium that disappears by october. If you are pricing in a slow season, apply a modest downward adjustment to summer comps or weight recent off-season listings more heavily.
Step 4: Build a rent range, not a single number
Successful landlords identify rent clusters rather than a single target number. A tight cluster of comps between $1,750 and $1,850 signals a predictable market. A wide spread from $1,500 to $2,100 signals that condition, amenities, or submarkets are driving major differences. A wide spread requires deeper analysis before you set a price.
Pro Tip: Strip out any comp that includes concessions like one month free rent. Advertised rent and effective rent are different numbers. Always compare effective rent to effective rent.
The table below shows how amenity adjustments change a raw comp into a normalized figure:
| Comp unit | Raw monthly rent | Amenity adjustment | Normalized rent |
|---|---|---|---|
| Unit A (no laundry, no parking) | $1,700 | +$150 (laundry) +$75 (parking) | $1,925 |
| Unit B (laundry, no parking) | $1,850 | +$75 (parking) | $1,925 |
| Unit C (laundry, parking, pets allowed) | $2,000 | -$50 (pet policy) | $1,950 |
After normalization, these three comps cluster tightly between $1,925 and $1,950. That is your market signal.
What is the step-by-step process for a rental comp analysis?
A repeatable workflow produces consistent results. Here is the process experienced investors use:
- Gather your comp sources. Active listings, recent leases, and property management companies are the top three data sources. Active listings show current market pricing. Recent leases show what tenants actually paid. Property managers often share market data informally, especially if you manage multiple units in the same area.
- Collect at least five to eight comps. Fewer than five gives you too little data to identify a cluster. More than ten becomes unwieldy unless you are using software to manage the set.
- Record key attributes for each comp. Document address, rent, square footage, bedroom and bathroom count, amenities, listing date, and lease date if available. A simple spreadsheet works fine at this stage.
- Normalize each comp. Apply the price per square foot calculation and amenity adjustments from the method above. Record the normalized rent for each comp.
- Weight your comps. Give more weight to comps that are geographically closest, most recently leased, and most similar in size and condition. A comp two blocks away that leased last month outweighs one a mile away that listed six months ago.
- Identify the rent range. Look at where your normalized comps cluster. Your target rent sits within that range, adjusted for your unit's specific condition and positioning.
- Test your pricing. Starting slightly higher and being ready to negotiate or reduce is an effective strategy in uncertain demand markets. If you get no inquiries in the first two weeks, the price is likely above market. If you get ten inquiries in three days, you may have priced too low.
Common mistakes to avoid:
- Using comps from a different submarket or zip code without adjusting for location differences
- Relying on listed rent instead of actual leased rent
- Ignoring concessions that inflate advertised prices
- Failing to update comps when market conditions shift
- Treating the highest comp as the target instead of the ceiling
For a deeper look at how rent pricing connects to overall returns, the maximum allowable offer method integrates comp data directly into acquisition pricing.
What tools do investors use to evaluate rental properties?
The tools you use depend on your portfolio size and how much time you want to spend on manual research.
Manual research methods work well for investors with one to five units. Platforms that aggregate active rental listings let you filter by location, bedroom count, and property type to build a comp set by hand. The limitation is that active listings show asking rents, not leased rents. You are seeing what landlords want, not what the market is paying.
Automated rent comp platforms solve the leased rent problem. These platforms pull from multiple listing services, property management software, and public records to show both asking and closed rents. Some offer API access for investors who want to pull comp data into their own models. Automated tools that perform multi-factor normalization and provide confidence intervals and adjusted comp scores give you a more precise rent estimate than manual methods alone.
HUD Fair Market Rent data serves as a useful cross-reference, especially for investors evaluating Section 8 or affordable housing properties. HUD publishes annual Fair Market Rent figures by metro area and bedroom count. These figures represent the 40th percentile of gross rents paid by recent movers. They are not a substitute for a full comp analysis, but they anchor your estimate to a government-verified baseline.
Deal-zilla's Rent Analyzer pulls real Section 8 data and HUD rates alongside market comps, giving investors a single view of both market rent and program rent for any property. That dual view is particularly useful when you are deciding whether a property works better as a market-rate or Section 8 rental. Investors analyzing duplex investment properties often use this approach to compare income scenarios across both units simultaneously.
Key Takeaways
Accurate rental comp analysis requires normalized data, recent comps, and a rent range built from a cluster of adjusted comparables rather than a single number.
| Point | Details |
|---|---|
| Use recent comps only | Comps older than 90 days reflect a different market and reduce pricing accuracy. |
| Normalize by square foot | Price per square foot normalization cuts rent estimate error by 30–40%. |
| Adjust for amenities | In-unit laundry adds $75–$150 per month; always adjust comps for amenity differences. |
| Build a rent range | A tight comp cluster signals a stable market; a wide spread demands deeper analysis. |
| Test and adjust pricing | Start slightly above your target range and adjust based on inquiry volume within two weeks. |
Why I think most investors underuse their comp data
Most landlords run a comp analysis once before listing and never revisit it. That is a mistake. Rental markets shift quarterly in high-demand metros, and a comp set that was accurate in february can be meaningfully wrong by may.
The more interesting problem is how investors interpret a wide rent spread. When comps range from $1,400 to $1,900 for the same bedroom count in the same zip code, most people pick a number in the middle and move on. The right move is to ask why the spread exists. Usually it comes down to condition, a recent renovation on the high end, or a distressed landlord pricing low to fill a vacancy fast. Understanding the cause tells you where your property actually sits in that range.
The other thing I have seen consistently is that focusing on tenant quality over maximum rent produces better long-term outcomes. A well-qualified tenant at $50 below peak market rent costs you far less than a vacancy, a turnover, or a collections problem. Rent comps give you the data to make that tradeoff consciously rather than by accident.
Rental comp analysis is one layer in a broader investment framework. It tells you what the market will pay. It does not tell you whether the deal pencils out at acquisition, how the property performs under different financing structures, or what your cash-on-cash return looks like at different rent levels. Use it as an input to your property cash flow analysis, not as a standalone decision.
— ARX
Deal-zilla makes rental comp analysis faster and more accurate
Pulling comps manually, normalizing them in a spreadsheet, and cross-referencing HUD data takes hours. Deal-zilla brings all of that into one place.

Deal-zilla's Rent Analyzer tool combines real Section 8 data, HUD Fair Market Rent rates, and market comp data so you can assess any rental property's income potential in minutes. The platform also includes a Deal Analyzer and BRRR calculator, so your rent comp feeds directly into your full investment model. Whether you are pricing a single-family rental or evaluating a multi-unit acquisition, Deal-zilla gives you the numbers you need to make a confident decision.
FAQ
What are rental comps?
Rental comps are recently leased or listed properties that closely match your unit in location, size, type, and amenities. Investors use them to determine a fair market rent for a property.
How many comps do I need for a reliable analysis?
Five to eight comps is the standard minimum for a reliable rent range. Fewer than five gives you too little data to identify a meaningful cluster.
How often should I update my rental comps?
Update your comp set every 60–90 days, or any time local market conditions shift noticeably. Comps older than 90 days reflect pricing that may no longer apply.
What does rent per square foot tell you?
Rent per square foot normalizes raw rent across units of different sizes. It reduces rent estimate error by 30–40% compared to comparing raw asking rents directly.
How does HUD Fair Market Rent data fit into a comp analysis?
HUD Fair Market Rent figures represent the 40th percentile of gross rents paid by recent movers in a given metro area. They serve as a government-verified baseline, especially useful when evaluating Section 8 rental properties.