
A high demand rental market is defined as a local housing market where vacancy rates fall below 5%, creating a structural shortage of available units that drives rent growth and reduces tenant turnover. Investors call this a landlord-favorable market because supply cannot keep pace with renter demand. Understanding what is a high demand rental market separates profitable acquisitions from costly mistakes. The signals are measurable, the data is public, and the investors who read them correctly gain a decisive edge on pricing, timing, and long-term cash flow.
What is a high demand rental market and how do you measure it?
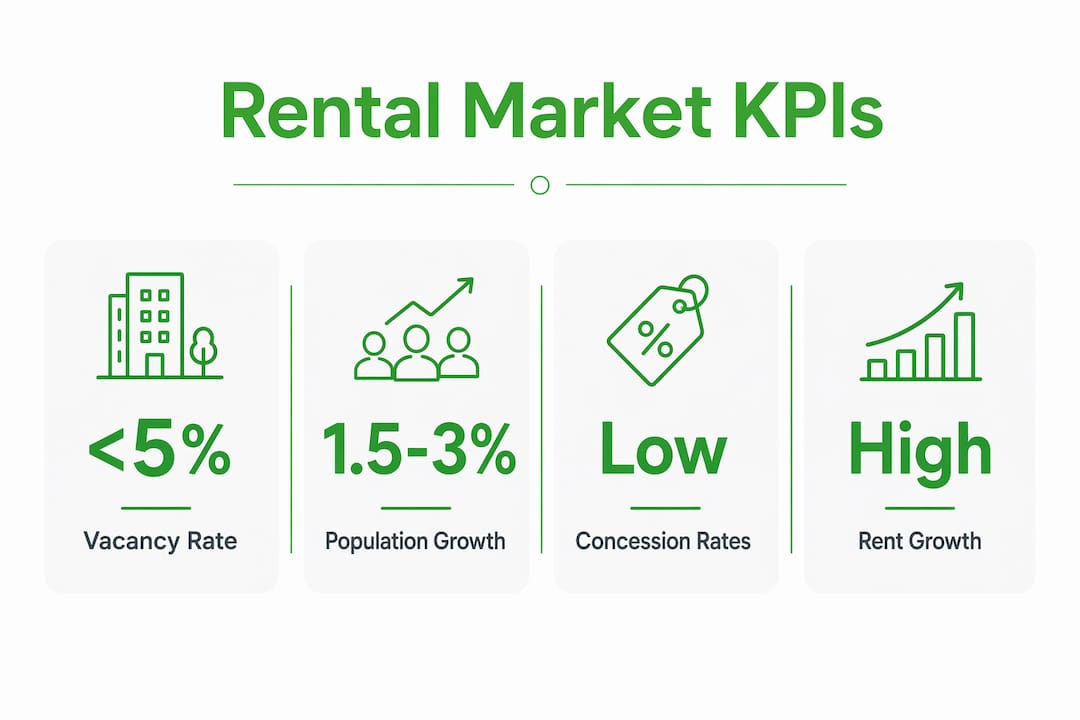
A high demand rental market is characterized by a chronic shortage of rental units, reflected in vacancy rates that stay consistently below 5%. At that threshold, landlords hold pricing power. They face fewer concessions, shorter vacancy periods, and stronger year-over-year rent growth.
The three core thresholds every investor should memorize:
- Below 5% vacancy: Shortage conditions. Landlords can raise rents and reject concessions.
- 5–8% vacancy: Balanced market. Rents hold steady, but landlord leverage is limited.
- Above 8% vacancy: Oversupply. Tenants gain negotiating power, and rent growth stalls or reverses.
Beyond vacancy rates, the Rental Competitiveness Index (RCI) gives investors a composite score of market tightness. The Midwest led the nation with an RCI score of 81.2 in 2026, driven by low new construction and roughly 9 renters competing for each available unit in suburban Chicago. That level of competition signals a market where landlords rarely need to offer move-in specials or rent discounts.
Concession rates are another reliable inverse indicator. When a market is truly tight, property managers stop offering free months, gift cards, or reduced deposits. Providence, Rhode Island topped Zillow's 2026 hottest rental markets list with only 12.9% of managers offering concessions, compared to national averages where concessions are far more common. Providence also posted 5% year-over-year rent growth with a typical rent of $2,154 per month. Low concession rates and strong rent growth together confirm genuine demand rather than headline noise.
Pro Tip: Track concession rates in your target market quarterly. A rising concession share is an early warning that supply is catching up to demand before vacancy data reflects it.
| Vacancy Rate | Market Signal | Landlord Position |
|---|---|---|
| Below 5% | Shortage | Strong pricing power, minimal concessions |
| 5–8% | Balanced | Moderate leverage, stable rents |
| Above 8% | Oversupply | Tenant-favorable, rent pressure downward |
How do regional and demographic trends shape rental demand?
Strong rental demand is not limited to coastal cities. The Midwest has emerged as one of the most competitive rental regions in the country, driven by affordable housing stock, steady job growth, and limited new construction pipelines. Suburban Chicago's renewal rate of 70.4% in 2026 reflects tenants who stay put because alternatives are scarce and moving costs are high.

Population growth is the most reliable long-term predictor of rental demand. Annual growth of 1.5–3% in a metro area signals sustained renter demand that supports rent appreciation over time. Static high rents without population growth often indicate a market near its ceiling, not one with room to run.
The demographic profile of renters has also shifted significantly. Higher-income households earning $75,000 or more increased by 1.7 million from 2021 to 2024, according to the Harvard Joint Center for Housing Studies. This shift pushes demand toward higher-amenity rentals, meaning investors in well-located, updated properties capture a renter pool that pays on time and stays longer.
Key regional and demographic factors that define high demand rental areas:
- Net population growth of 1.5–3% annually in the metro or submarket
- Job market diversification across multiple industries, reducing exposure to single-employer risk
- Rising median household income among renters, signaling ability to absorb rent increases
- Low new construction permits relative to population growth, preserving supply constraints
- High renewal rates above 65%, indicating tenant satisfaction and limited alternatives
Pro Tip: Do not evaluate a city-wide average. Analyze at the submarket level. A metro with 6% overall vacancy may contain ZIP codes running at 3%, where your actual property will compete.
Why does supply constraint define the best rental markets?
Supply is the variable most investors underestimate. A market can have strong population growth and job expansion, but if developers build faster than demand absorbs new units, rent growth collapses. Markets like Austin and Phoenix experienced exactly this dynamic in 2026, where rapid supply surges created tenant-favorable conditions and downward pressure on rents despite strong underlying demand.
Geographic constraints and strict zoning act as natural brakes on oversupply. Markets with these structural limits preserve landlord returns even during periods of strong demand because developers cannot simply build their way to equilibrium. Nashville and Boise are examples where topography and regulatory friction have historically slowed supply responses, protecting existing landlords from sudden rent dilution.
Monitoring new construction permits is a forward-looking discipline. Oversupply warnings typically precede rent growth slowdowns by 2–3 years, meaning an investor who buys into a market today based on current vacancy rates may face a very different environment at refinance or resale.
| Market Type | Supply Constraint | Rent Growth Outlook |
|---|---|---|
| Geographic limits, strict zoning | High | Stable to strong |
| Moderate zoning, limited land | Medium | Moderate, cyclical |
| Open land, developer-friendly | Low | Volatile, concession-prone |
Pro Tip: Pull 12-month building permit data from the U.S. Census Bureau for any market you are evaluating. Compare permits issued to current household formation rates. A ratio above 1.2 permits per new household is a supply warning.
How to apply rental market insights to investment decisions
Identifying a high demand rental market is only useful if you translate that knowledge into specific acquisition criteria. The following framework gives investors a repeatable process for evaluating any market before committing capital.
-
Check vacancy rates first. Pull current and trailing 12-month vacancy data for the submarket, not the metro. A rate consistently below 5% is the minimum threshold for a landlord-favorable market. Use this as a filter before analyzing any other metric.
-
Confirm rent growth trends. Look for year-over-year rent growth above inflation. Flat or declining rents in a low-vacancy market often signal a demographic ceiling or income constraint that limits future appreciation. Review comparable rental properties to benchmark current asking rents against closed lease data.
-
Evaluate population and job growth. A market with vacancy below 5% and population growth of 1.5–3% annually offers the most stable conditions for long-term rent appreciation. Cross-reference job growth across at least three industries to confirm economic diversification.
-
Audit the supply pipeline. Review active construction permits and planned deliveries for the next 24 months. Avoid markets where new supply exceeds 3% of existing stock annually. This is the single most overlooked step in rental market analysis.
-
Measure concession rates. Low concession prevalence confirms that landlords hold pricing power. A market where fewer than 20% of managers offer concessions is structurally tight. Use this metric alongside vacancy to validate demand before setting your maximum allowable offer.
-
Factor in delinquency risk. The national rent delinquency rate rose from 4.3% in january 2026 to 11.6% by june 2026, according to Hemlane. That swing underscores why submarket economic diversity matters as much as vacancy rates. A tight market with a fragile single-employer economy carries hidden cash flow risk.
Key Takeaways
A high demand rental market is defined by vacancy rates below 5%, confirmed by population growth of 1.5–3% annually, low concession rates, and a supply pipeline that cannot outpace demand.
| Point | Details |
|---|---|
| Vacancy rate threshold | Below 5% signals landlord-favorable conditions with strong rent growth potential. |
| Supply pipeline risk | New construction exceeding demand erases rent growth within 2–3 years of delivery. |
| Demographic shift | Higher-income renters now drive demand, favoring updated, amenity-rich properties. |
| Regional opportunity | Midwest markets like suburban Chicago post RCI scores above 80, signaling intense competition. |
| Delinquency as a risk signal | Rising delinquency rates reveal economic fragility that vacancy data alone does not capture. |
What I have learned about spotting markets that actually hold up
Most investors I have watched make the same mistake. They see a headline rent of $2,200 per month and assume the market is strong. Rent price alone tells you almost nothing. What matters is whether that rent is rising, whether tenants are staying, and whether the supply pipeline will flood the market in 18 months.
The metric I trust most is the submarket vacancy rate, not the city-wide figure. I have seen metros with 7% overall vacancy contain specific ZIP codes running at 2.8%, where a well-located duplex generates a waiting list. City-wide averages mask the real opportunity and the real risk.
Delinquency rates are the indicator most investors ignore entirely. A rising delinquency rate tells you that tenants are struggling to pay even in markets with low vacancy. That combination, tight supply but stressed tenants, is a warning sign about the local economy, not a green light. I always cross-reference delinquency trends with local unemployment data before finalizing any acquisition.
The other lesson I keep relearning: respect the supply pipeline. I have watched investors buy into markets with 4% vacancy and strong rents, only to see 2,000 new units deliver 18 months later and watch their rent growth evaporate. Checking building permits and zoning constraints before you close is not optional. It is the difference between a five-year hold that compounds and one that stalls.
— ARX
Deal-zilla tools for rental market analysis
Knowing what defines a high demand rental market is the first step. Applying that knowledge to specific deals is where returns are actually made.
Deal-zilla gives real estate investors the tools to move from market research to deal analysis without switching platforms. The Section 8 Investment Analyzer pulls real HUD rate data so you can evaluate rent potential against actual government payment schedules, not estimates. The Deal Analyzer and BRRR Calculator let you stress-test acquisitions against vacancy assumptions and rent growth scenarios before you commit. For investors targeting cash flow improvement in tight rental markets, Deal-zilla's Rent Analyzer benchmarks your target property against live market comps. Visit Deal-zilla to put real data behind your next acquisition.
FAQ
What vacancy rate defines a high demand rental market?
A vacancy rate consistently below 5% defines a high demand rental market. At this threshold, landlords hold pricing power, concessions are rare, and rent growth is sustained.
What drives rental demand in a specific market?
Population growth of 1.5–3% annually, job market expansion across multiple industries, and limited new housing supply are the primary drivers of sustained rental demand.
How do I identify high demand rental areas before buying?
Check submarket vacancy rates, trailing rent growth, concession prevalence, and 12-month building permit data. Markets with vacancy below 5% and low concession rates signal genuine landlord leverage.
Why are Sun Belt markets losing rental momentum in 2026?
Markets like Austin and Phoenix saw rapid new supply deliveries that outpaced local demand, creating tenant-favorable conditions and downward rent pressure despite strong population growth.
What is the Rental Competitiveness Index?
The Rental Competitiveness Index (RCI) is a composite score measuring market tightness based on vacancy, renewal rates, new construction, and competition per unit. The Midwest led the nation with an RCI of 81.2 in 2026.