
Fair Market Rent (FMR) is defined by HUD as the 40th percentile gross rent estimate for standard-quality housing in a given area, inclusive of utilities. Real estate investors who know how to compare FMR rates across cities gain a standardized, government-backed benchmark that private listing data simply cannot match. HUD publishes updated FMR figures annually, with 2026 rates now available by metro area and county. Used correctly, this data reveals where rents are underpriced, where demand is outpacing supply, and where your next acquisition might generate the strongest returns.
How to compare FMR rates across cities: data sources and tools
The HUD USER website is the primary source for annual FMR data. It publishes rates by county and metropolitan statistical area, updated each fiscal year, and available as downloadable tables. Every serious investor should bookmark it before running any city FMR differences analysis.
Standard metro-wide FMRs are useful for broad comparisons, but they mask significant neighborhood-level variation. That is where Small Area Fair Market Rents (SAFMRs) become critical. SAFMRs provide ZIP code-level FMR estimates for select metro areas, giving investors a far more accurate picture of what rents look like block by block rather than city by city.

The key difference between standard FMR and SAFMR comes down to granularity. A metro-wide FMR for Los Angeles covers hundreds of neighborhoods with wildly different rent levels. An SAFMR for a specific ZIP in Culver City versus one in Compton will show a gap that the metro average completely hides. For investors targeting specific neighborhoods, hyper-local SAFMR data is underutilized but provides critical granularity in competitive markets.
Third-party platforms that incorporate HUD data can speed up the comparison process. These tools pull FMR figures and layer them alongside current market listings, vacancy rates, and rental trends. Deal-zilla's Rent Analyzer does exactly this, combining real HUD FMR data with live market inputs so investors can see both the benchmark and the actual market gap in one place.
- HUD USER portal: Download annual FMR tables by county, metro, or state for free.
- SAFMR datasets: Available for designated metro areas; use these when targeting specific ZIP codes.
- Deal-zilla Rent Analyzer: Combines HUD FMR data with real-time market comparisons for investor-ready analysis.
- Local MLS and listing data: Cross-reference FMR against active listings to measure the gap between benchmark and market.
Pro Tip: Always download the most recent fiscal year FMR table directly from HUD USER rather than relying on third-party aggregators, which sometimes display outdated figures.
How do FMR rates vary across cities?
The range of FMR rates across American cities is wider than most investors expect. A 2-bedroom FMR in Los Angeles sits at $2,903, while the same unit type in Asheville, NC comes in at $1,835. That $1,068 gap represents a fundamentally different investment thesis in each market.
Coastal metros consistently post the highest average FMR rates. High land values, constrained housing supply, and strong job markets all push rents upward. Rural counties sit at the opposite end. FMR disparities between coastal metros and rural counties can exceed a 5:1 ratio, meaning a 2-bedroom unit in rural Mississippi might carry an FMR a fraction of what San Francisco reports.
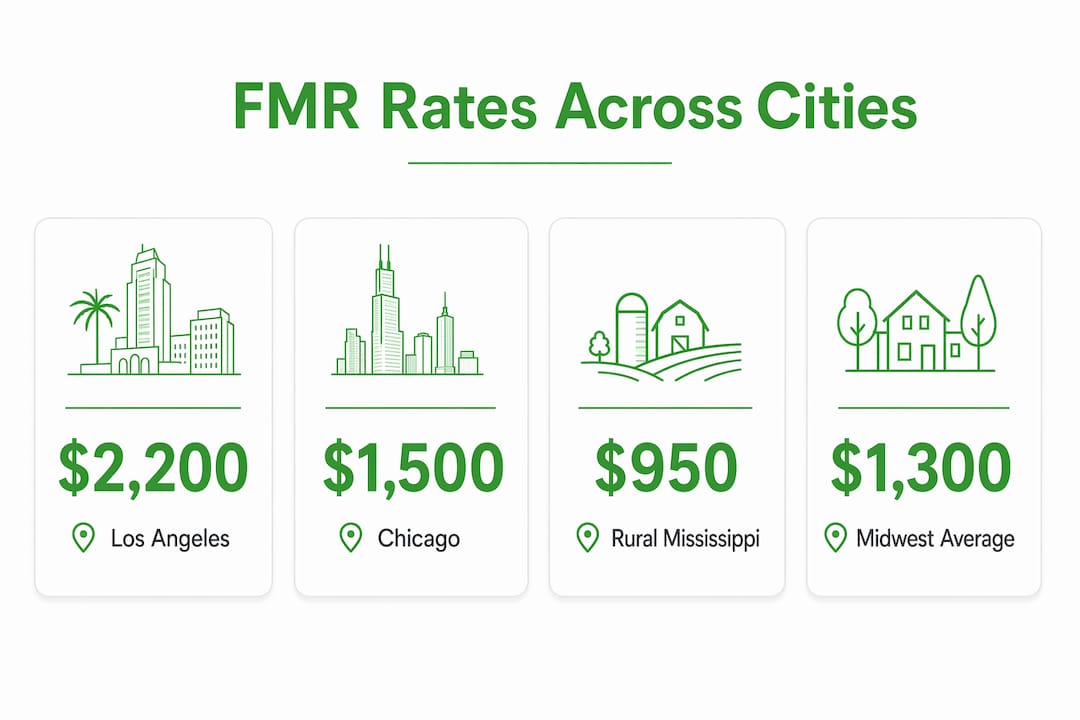
HUD calculates FMR using American Housing Survey data and Census Bureau figures, then trends the results forward to the current year using local Consumer Price Index data. The methodology filters out recently built units and luxury properties to focus on modest, standard-quality housing. This is why FMR reflects what a working-family renter pays, not what a luxury high-rise commands.
The table below illustrates how city FMR differences play out across unit sizes for a sample of markets.
| City / Metro Area | 1-Bedroom FMR | 2-Bedroom FMR | 3-Bedroom FMR |
|---|---|---|---|
| Los Angeles, CA | $2,222 | $2,903 | $3,897 |
| Asheville, NC | $1,412 | $1,835 | $2,389 |
| Austin, TX | $1,598 | $1,987 | $2,601 |
| Rural Mississippi | ~$600 | ~$780 | ~$1,020 |
Note: Rural Mississippi figures are approximate ranges based on published HUD county-level data. Verify exact figures on HUD USER for your target county.
Pro Tip: When you compare FMR rates by location across multiple cities, always pull the same bedroom count for each market. Mixing unit sizes in your comparison table produces misleading conclusions.
For units larger than 4 bedrooms, HUD adds 15% per additional bedroom to the 4-bedroom FMR rate. This formula gives investors a consistent way to estimate rents on larger properties without guessing.
What are the common pitfalls when comparing FMR between cities?
FMR data is powerful, but it carries real limitations that can mislead investors who treat it as a market ceiling rather than a conservative floor. Understanding these pitfalls separates disciplined analysts from investors who overpay or underprice.
The most significant limitation is data lag. HUD FMR data carries a 1–2 year lag due to survey collection timelines and the trending adjustments applied afterward. In fast-growing markets like Austin or Nashville, this lag means the published FMR may already be well below what landlords are actually charging.
Market rents typically exceed FMR by 10–40%, especially for newer construction or units in high-demand neighborhoods. FMR reflects the 40th percentile, which means 60% of actual market rents are already above it. Investors who price at FMR in a hot market leave money on the table.
Metro-wide FMR averages also mask intra-city variability. A single FMR figure for the Dallas-Fort Worth metro covers neighborhoods with rents ranging from $900 to $2,500 for the same bedroom count. Relying on the metro average without drilling into ZIP-level SAFMR data produces a blurry picture.
The key pitfalls to watch for:
- Data lag: Published FMRs may be 1–2 years behind current market conditions.
- 40th percentile floor: FMR excludes the top 60% of the market by design.
- Metro averaging: A single metro FMR hides wide neighborhood-level variation.
- Luxury exclusion: Newly built or high-end units are filtered out of FMR calculations.
- Single-source reliance: Combining FMR with real-time market data is the only way to get an accurate rent picture.
Step-by-step process to compare FMR rates for investment decisions
A repeatable workflow turns raw FMR data into investment-grade analysis. The steps below apply whether you are evaluating two cities or twenty.
-
Identify your target cities. List the metros or counties you are considering. Be specific: use county names or metro statistical area codes, not just city names, since HUD data is organized by these designations.
-
Pull 2026 FMR data from HUD USER. Download the current fiscal year FMR table for each target area. Filter by bedroom count to match your target property type. This gives you standardized numbers on the same scale.
-
Check SAFMR availability. If your target city has SAFMR data published, pull ZIP-level figures for the specific neighborhoods you are analyzing. This step is especially important in large metros where neighborhood variation is high.
-
Adjust for unit size. For properties with more than 4 bedrooms, apply the HUD formula: add 15% to the 4-bedroom FMR for each additional bedroom. This keeps your comparison consistent across different property sizes.
-
Build a comparison table. Tabulate FMR by city and bedroom count side by side. Include both metro-wide FMR and SAFMR where available. Visual comparison immediately highlights which markets offer the strongest rent-to-price ratios.
-
Cross-reference with current market listings. Pull active rental listings for each target market and calculate the gap between FMR and actual asking rents. A large gap signals either a hot market or a data lag issue. Both require further investigation.
-
Apply FMR as a negotiation baseline. Professional investors use HUD FMR data as an objective anchor in lease negotiations, separating their position from potentially inflated private listing data. This approach carries particular weight in regulated or Section 8 markets.
-
Generate your investment insight. Compare the FMR floor against your target acquisition price and projected rent. Use tools like Deal-zilla's Section 8 Investment Analyzer to run the numbers against real HUD data and stress-test your assumptions before committing capital.
For a deeper look at how to read the actual HUD rate charts once you have downloaded them, the HUD rate chart guide from Deal-zilla walks through each column and what it means for rent estimation.
Why I think most investors misread FMR data
Most investors treat FMR as a ceiling. That is the wrong frame entirely. FMR is a floor, and a conservative one at that.
The 40th percentile methodology means the market has already priced 60% of rentals above FMR before you even start your analysis. When I see investors price a unit at FMR and call it done, they are systematically undercharging in markets where demand has moved well past what the survey data captured. The gap between FMR and actual market rents is not a flaw in the data. It is a signal worth reading carefully.
The investors who get the most out of FMR comparisons are the ones who use it as a starting point, not a conclusion. They pull the SAFMR for the specific ZIP, check current listings, and then position their rent above FMR while staying competitive with the local market. That combination of government benchmark and live market data is where the real analysis happens.
My strongest recommendation: revisit your FMR assumptions at least once per fiscal year when HUD publishes new rates. Markets move fast, and a 2-year-old FMR figure in a city like Austin or Phoenix is practically useless for current pricing decisions. Treat FMR as a living input, not a static number you pull once and file away.
— ARX
Deal-zilla puts FMR data to work for your portfolio
Real estate investors who want to move from raw HUD tables to actual investment decisions need more than a spreadsheet.

Deal-zilla brings together real HUD FMR data, a Section 8 Investment Analyzer, a BRRRR calculator, and a Rent Analyzer in one platform built specifically for investors. You can compare rental properties across cities using actual HUD rates, run deal analysis against current market conditions, and stress-test your rent assumptions before you make an offer. Whether you are targeting Section 8 tenants, fix-and-flip opportunities, or long-term buy-and-hold plays, Deal-zilla gives you the data infrastructure to make decisions with confidence. Visit Deal-zilla to start your analysis today.
Key takeaways
Comparing FMR rates across cities requires combining official HUD benchmark data with real-time market listings, SAFMR ZIP-level figures, and a clear understanding of the 40th percentile methodology to make accurate investment decisions.
| Point | Details |
|---|---|
| FMR is a floor, not a ceiling | Market rents exceed FMR by 10–40%, so use it as a minimum baseline, not a pricing target. |
| Use SAFMR for neighborhood precision | ZIP-level SAFMR data reveals intra-metro variation that metro-wide averages hide. |
| Account for data lag | HUD FMR carries a 1–2 year lag; always cross-reference with current market listings. |
| Apply the bedroom adjustment formula | For units over 4 bedrooms, add 15% per additional bedroom to the 4-bedroom FMR rate. |
| Combine data sources | Pair HUD FMR with live rental listings and tools like Deal-zilla for investment-grade analysis. |
FAQ
What is Fair Market Rent and how does HUD calculate it?
Fair Market Rent is HUD's estimate of the 40th percentile gross rent for standard-quality housing in a given area, inclusive of utilities. HUD calculates it using American Housing Survey and Census Bureau data, then trends the result forward using local Consumer Price Index figures.
How often does HUD update FMR rates?
HUD publishes new FMR rates annually, typically effective at the start of each federal fiscal year in october. The 2026 rates are currently available on the HUD USER portal by county and metro area.
What is the difference between FMR and Small Area FMR?
Standard FMR covers an entire metro area with a single rate, while Small Area FMR (SAFMR) provides ZIP code-level estimates for select metros. SAFMR is more accurate for investors targeting specific neighborhoods within large cities.
Why do market rents often exceed FMR?
FMR reflects only the 40th percentile of gross rents and excludes newly built and luxury units. This means 60% of actual market rents are already above FMR by design, and the gap widens further in fast-growing or supply-constrained cities.
Can I use FMR data for Section 8 investment analysis?
Yes. HUD FMR rates directly determine the maximum Housing Choice Voucher payment in each area, making them the essential benchmark for Section 8 investment analysis. Tools like Deal-zilla's Section 8 Investment Analyzer apply these rates directly to property-level deal analysis.