
A complete real estate market research packet for Housing Choice Voucher investors delivers three things: proof of local rent demand, confirmation that HUD payment standards cover your target rent, and enough supply/demand data to negotiate the purchase price. Start by checking the Realtor.com Market Clock position for your target metro, pull the HUD payment standard for the specific ZIP code, then run an address-level deal scan in Deal-zilla to confirm cash flow before you spend another hour on due diligence.
Table of Contents
- Why local market research changes Section 8 deal decisions
- What market-level metrics you should pull every month
- Section 8 signals that belong in every market packet
- A repeatable 9-step research workflow
- How to convert market research into underwriting numbers
- A mini case study: one address, start to finish
- Which data sources and tools actually do the job
- How long this research takes and what it costs
- Key Takeaways
- What the data keeps showing us about failed Section 8 deals
- Deal-zilla puts this entire workflow in one place
- Primary sources and further reading
Why local market research changes Section 8 deal decisions
National headlines are noise for HCV investors. A metro where the national median list price is $430,000 and asking prices fell 2.5% year over year may still contain sub-markets where HUD payment standards sit 15% below market rent, making voucher capture nearly impossible. That gap kills deals that look fine on paper.
The 2026 market adds real leverage for buyers who do the work, as detailed in how to attract investors to your property development project. A large share of the top 100 metros now favor buyers or are moving in that direction, marking one of the most buyer-friendly springs since 2019. But fragmentation is the defining feature: one zip code can be a buyer's market while the adjacent one is still tight. Running metro-level housing market analysis without drilling to the county or ZIP level means you are negotiating blind.
For Section 8 landlords specifically, two additional factors shift the calculus:
- Rent-reasonableness checks at the PHA level can reject a unit even when the HUD payment standard technically covers the rent, if comparable units in the area rent lower.
- Inspection hold-ups delay your first voucher payment, sometimes by 30–60 days, which your underwriting must absorb.
Stat: Pending home sales have risen for seven consecutive months through mid-2026, signaling rising demand that can tighten inventory faster than monthly reports reflect.
Cohen & Steers notes that stable lease cash flows support real estate valuations at the sector level, but that tenant creditworthiness and lease predictability are what actually protect individual asset values. For HCV landlords, HUD is the tenant in economic terms, and its payment reliability is worth stress-testing before you close.
What market-level metrics you should pull every month
NAR recommends tracking the Housing Affordability Index, Pending Home Sales, and county-level median prices as the empirical foundation for any deal assessment. For Section 8 investors, add three more layers.
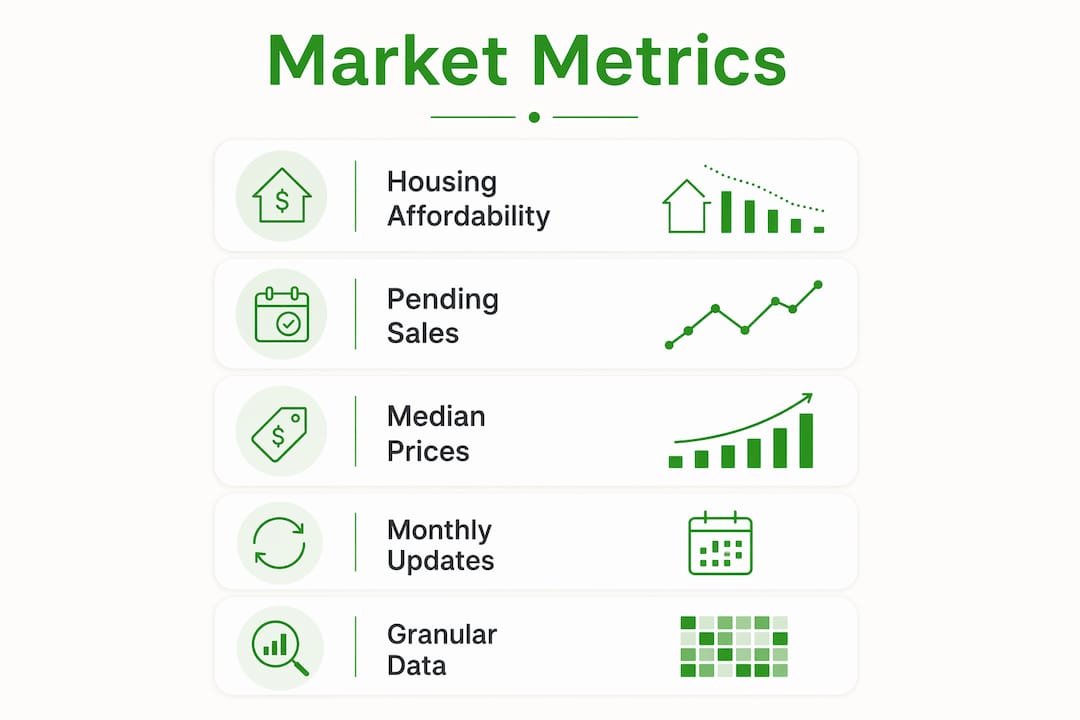
| Metric | Why it matters for HCV investors | Update frequency |
|---|---|---|
| Housing Affordability Index | Low affordability = more renters, stronger voucher demand | Quarterly |
| Pending Home Sales | Leading demand signal; rising = tightening supply ahead | Monthly |
| County median list price | Sets your acquisition anchor and comp baseline | Monthly |
| Active inventory + days on market | Measures negotiating room; A median days on market duration nationally in mid-2026 | Weekly/monthly |
| Share of listings with price cuts | In June 2026, 18.8% of listings saw a price cut; use this share as a negotiation anchor. | Monthly |
| Median list price per sq. ft. | Normalizes comps across unit sizes | Monthly |
| Rent trend index (ZIP level) | Confirms voucher-captured rent is sustainable | Quarterly |
Pull data at four levels of granularity: metro, county, ZIP, and census tract. Metro data tells you the cycle position. County data anchors your offer price. ZIP and tract data tell you whether a specific block will pass a rent-reasonableness check. Skipping the tract level is where most investors leave money on the table, or worse, buy into a micro-market where HUD payment standards are structurally below what the neighborhood actually rents for.

Section 8 signals that belong in every market packet
Standard housing market analysis misses the voucher layer entirely. These are the data points that change whether a deal works.
- HUD payment standards by ZIP/bedroom count: the maximum subsidy HUD will pay; pull directly from HUD Exchange or the local PHA's published schedule.
- Voucher utilization rate: the share of issued vouchers that are actually leased up. A low rate often means landlords are not participating, which signals either a difficult inspection process or payment standards too low to attract supply.
- Waitlist length and status: a long, open waitlist means tenant demand is real and durable. A closed waitlist with a short queue can mean the program is shrinking.
- Landlord participation rate: low participation in a market is a red flag and an opportunity simultaneously. It means less competition for voucher tenants but also suggests friction in the PHA relationship.
- Rent-reasonableness comps: the PHA compares your unit's rent to unassisted units of similar size, age, and location. If market rents have risen faster than payment standards, you may be capped below what the market would otherwise support.
- Payment timeliness history: ask other local landlords or check investor forums. Some PHAs pay on the 1st reliably; others run 10–15 days late routinely, which affects your debt service coverage.
Pro Tip: Before you contact the PHA, check their website for a published payment standard schedule. Most PHAs update these annually in October. If the schedule on the site is more than 12 months old, call and confirm whether an update is pending, because a payment standard increase can change your underwriting by $100–200/month.
For a deeper primer on reading HUD rate charts, the Deal-zilla blog has a practical walkthrough on how to read HUD rate charts that covers bedroom-size adjustments and exception payment standards.
| Signal | Green | Red |
|---|---|---|
| Payment standard vs. market rent | Within 5% of market | More than 10% below market |
| Voucher utilization | Above 90% | — |
| Waitlist status | Open, large waitlist | Closed, under 100 |
| Landlord participation | Growing YoY | Declining or flat |
A repeatable 9-step research workflow
Run these steps in order. Each one either confirms the deal or surfaces a reason to stop.
-
Metro market scan (30–60 min): Check the Market Clock position for your target metro. Buyer's market = negotiating room. Seller's market = tighter offer strategy.
-
HUD payment standard pull (10–20 min): Go to HUD Exchange or the local PHA site. Pull the payment standard for the target ZIP and bedroom count.
-
Rent comp check (20–30 min): Pull 5–10 comparable active rentals from Realtor.com, Redfin, or PadMapper. Confirm the payment standard is within 5–10% of market rent.
-
Supply/demand check (15–20 min): Pull active inventory, days on market, and pending sales for the ZIP. Rising pending sales with falling inventory = act faster.
-
Price-cut analysis (10 min): Check the share of listings with price cuts. If it is around 18.8% in June 2026, this indicates sellers are motivated; use the observed share as a negotiation anchor.
-
Neighborhood verification (1–2 hours on-site): Walk the block. Check proximity to schools, transit, and services. Run a quick crime and eviction data check via county/city portals.
-
Inspection and repair scope (1–2 hours): Get a rough repair estimate before you make an offer. HUD inspections are strict; budget for items that would fail an HQS inspection.
-
Underwriting inputs (30–45 min): Plug voucher-adjusted rent, vacancy assumption, operating expenses, and CapEx reserves into your deal model.
-
Go/no-go decision: If cash flow is positive after stress tests and the HUD payment standard covers rent-reasonableness, proceed. If either fails, stop.
Pro Tip: Use free sources (HUD Exchange, Realtor.com, county assessor) for steps 1–5. Only escalate to paid MLS access or a professional report if the deal passes the free-data screen. You will save 80% of your research time by killing bad deals early.
How to convert market research into underwriting numbers
Start by replacing the generic market rent in your model with the voucher-adjusted effective rent: the lower of the HUD payment standard and the rent-reasonableness comp. That single substitution changes your gross scheduled income and every ratio downstream.
| Assumption | Conservative input | Stress-test input |
|---|---|---|
| Gross scheduled rent | HUD payment standard | 90% of payment standard |
| Vacancy / turnover | 5% | 10% (includes inspection delay) |
| Operating expenses | 40% of GSR | 45% of GSR |
| CapEx reserve | $100/month | $100–200/month |
| HUD payment timing | On-time (1st) | 15-day lag |
| Voucher utilization | 90% | 90% |
Run the stress test at 90% voucher utilization and a 60-day inspection delay on the first lease-up. If the deal still cash-flows at those inputs, you have a margin of safety. If it breaks even or goes negative, the deal needs a lower purchase price or a higher payment standard to work. For cash-on-cash return benchmarks specific to Section 8 deals in 2026, Deal-zilla's blog walks through real examples with worked numbers.
A mini case study: one address, start to finish
Decision up front: the hypothetical deal below pencils at a conservative cash-on-cash return after stress testing, driven by a payment standard that sits above local market rent.
- Metro scan shows the target city is in a buyer's market (Market Clock Q2 2026).
- HUD payment standard for a 3-bedroom in the target ZIP: $1,450/month.
- Realtor.com and Redfin comps show comparable 3-bedrooms renting at $1,380–$1,420/month. Payment standard exceeds market rent by roughly 5%, meaning voucher capture is straightforward.
- Active inventory is up, days on market at 58 days, and 18.8% of listings saw price cuts in June 2026. Offer at 94% of list price.
- On-site visit confirms the block is stable; county eviction data shows low filings in the tract.
- Repair estimate: $8,500 to bring the unit to HQS standards (paint, HVAC filter, handrails).
- Underwriting: purchase price $185,000, 25% down ($46,250), gross scheduled rent $1,450, vacancy 5%, expenses 40%, CapEx $100/month. Monthly cash flow: approximately $210 before stress test.
- Stress test at 90% utilization and 60-day delay: first two months produce no voucher income. Cash flow turns negative for those months but recovers in month 3. Annual cash-on-cash remains positive.
- Decision: go, contingent on inspection passing.
Running this workflow manually takes several hours. Deal-zilla's address-level HUD pull, built-in rent comps, and stress-test model compress steps 2, 3, and 7 into under 20 minutes, and the PDF export gives you a shareable deal summary for lenders or partners.
Which data sources and tools actually do the job
Combine free authoritative data with targeted paid tooling. The free layer handles market cycle position and voucher signals. Paid tools earn their cost when you are running multiple deals per quarter.
| Source / Tool | Best for | Cost |
|---|---|---|
| Realtor.com Market Clock | Metro cycle position, negotiating context | Free |
| NAR Housing Statistics | Affordability Index, Pending Home Sales definitions | Free |
| HUD Exchange / Local PHA | Payment standards, utilization, program rules | Free |
| County assessor portal | Ownership history, tax data, prior sale prices | Free |
| Redfin market snapshot | Quick rent and price sanity check | Free |
| PadMapper / Craigslist | Street-level rent comps, landlord participation signals | Free |
| MLS access / data vendor | Deep comp pulls, off-market data | $200–800/month |
| Deal-zilla | Address-level HUD pull, rent comps, stress testing, PDF export | Tiered subscription |
Pro Tip: Run the free-data checklist first on every deal. If the deal survives steps 1–5 of the workflow on free data alone, that is when a Deal-zilla subscription pays for itself: it compresses the remaining steps from hours to minutes and produces a lender-ready PDF.
The minimum free-data checklist: Market Clock position + HUD payment standard + 5 rent comps + county assessor pull. If those four inputs do not support the deal, no paid tool will save it.
For investors evaluating low-risk rental strategies in 2026, the free-first approach also keeps research costs near zero on deals that do not close.
How long this research takes and what it costs
An initial market packet built on free sources takes 2–6 hours. A full address-level diligence run, including on-site verification and a repair estimate, typically runs 1–2 days.
| Research phase | Time estimate | Typical cost |
|---|---|---|
| Free market packet (steps 1–5) | 2–6 hours | — |
| Full address diligence (steps 1–9) | 1–2 days | —–$200 (gas, time) |
| HQS-ready inspection | 2–4 hours scheduled | $200–$1,500 |
| Repair/CapEx estimate | 1–3 hours | —–$300 (contractor quote) |
| MLS or data vendor access | Ongoing | $200–$800/month |
| Deal-zilla subscription | Ongoing | Tiered; limited free tier available |
Subscribe to a paid tool when you expect to run 3–5 deals in a 12-month period, or when the tool shortens your time-to-close by more than its monthly fee. At one deal per quarter, the time savings on underwriting alone typically justify the cost.
- Free tools cover market cycle, HUD standards, and basic comps.
- Low-cost subscriptions ($20–$100/month) add automated comp pulls and alert systems.
- Professional MLS access ($200–$800/month) makes sense for investors running 10+ deals per year.
- Inspection and repair estimates ($200–$1,500 per property) are non-negotiable before any HCV unit closes.
Key Takeaways
Thorough real estate market research for Section 8 investors combines local market signals, HUD payment standard verification, and conservative stress-tested underwriting before any offer is made.
| Point | Details |
|---|---|
| Local beats national | Metro fragmentation in 2026 means ZIP-level data changes deal decisions that national averages would get wrong. |
| HUD payment standard first | Pull the payment standard before running any other number; it sets your effective gross rent and every ratio downstream. |
| Stress test every deal | Model 90% voucher utilization and a 60-day inspection delay; if cash flow survives, you have a real margin of safety. |
| Free data covers the first screen | The Market Clock, HUD Exchange, and Redfin comps cost nothing and eliminate most bad deals before you spend a dollar on paid tools. |
| Deal-zilla accelerates the workflow | Address-level HUD pulls, rent comps, and PDF exports compress the underwriting steps from hours to under 20 minutes. |
What the data keeps showing us about failed Section 8 deals
Most deals that fall apart in the HCV space fail for one of two reasons: the rent-reasonableness check comes back lower than the investor assumed, or an inspection hold-up drains reserves before the first voucher payment arrives. Neither of these shows up in a standard housing market analysis. They only surface when you run the voucher-specific layer of research described above.
The 2026 market context actually helps investors who do this work. Sellers are pricing more realistically at listing rather than waiting to cut later, which means your negotiated purchase price is more likely to reflect true market value from day one. Combine that with buyer-friendly conditions in 70% of major metros and you have a window to acquire at prices that leave room for the inspection and repair costs that HCV properties require. The national median list price is $430,000 as of June 2026.
The workflow in this guide is not complicated. It is just more specific than what most general real estate guides recommend, and that specificity is exactly what makes the difference between a deal that cash-flows and one that breaks even on paper but loses money in practice.
Deal-zilla puts this entire workflow in one place
Pulling HUD payment standards, running rent comps, stress-testing cash flow, and exporting a lender-ready PDF used to mean four separate tools and a spreadsheet. Deal-zilla bundles all of it into a single address-level workflow built specifically for HCV investors.

The Section 8 Investment Analyzer pulls live HUD payment standards for any address, surfaces local rent comps, runs BRRR and hard money scenarios, and stress-tests your assumptions before you commit. Heat maps show you which ZIP codes have the strongest voucher utilization. The PDF export gives lenders and partners a clean deal summary without your rebuilding it from scratch each time. Deal-zilla offers a limited free tier so you can run your first address scan at no cost, with full-featured paid plans that scale as your deal volume grows. Start your free scan at Deal-zilla and see whether your next target address actually pencils before you spend a day on due diligence.
Primary sources and further reading
| Source | Best used for |
|---|---|
| Realtor.com Market Clock Q2 2026 | Metro cycle position and negotiating leverage |
| Realtor.com June 2026 Housing Report | Median list price, price-cut share, days on market |
| Realtor.com 2026 Midyear Forecast | Mortgage rate context, rent growth projections |
| NAR Housing Statistics | Affordability Index definitions, Pending Home Sales |
| Cohen & Steers Mid-Year 2026 Perspective | Sector-level lease stability and underwriting rationale |
| HUD Exchange / Local PHA pages | Payment standards, voucher utilization, program rules |
| Deal-zilla blog: HUD rate charts | Practical guide to reading payment standard schedules |
| Deal-zilla blog: Section 8 market comparison | Market comparison factors specific to HCV investing |
| Deal-zilla | Address-level underwriting, HUD pulls, deal modeling |