
Rental property ROI is defined as the total financial return an investment property generates relative to the capital you put in. To analyze rental property ROI accurately, you need three core metrics: cap rate, cash-on-cash return, and total ROI including appreciation and equity buildup. Industry benchmarks for 2026 show a strong rental investment targets 8–12% cash-on-cash return and 10–15% total annual return. Getting these numbers right before you buy separates profitable landlords from ones who wonder why their property never seems to perform.
What are the key rental property ROI metrics and how do you calculate them?
Every serious investor needs to know five metrics. Each one answers a different question about your property's performance.

Net Operating Income (NOI)
NOI is the foundation of every other calculation. The formula is simple: gross rental income minus vacancy losses minus all operating expenses. If a property collects $24,000 per year in rent, has 5% vacancy ($1,200), and $8,000 in operating expenses, the NOI is $14,800. Every other metric builds on this number, so an error here cascades through your entire analysis.
Cap rate
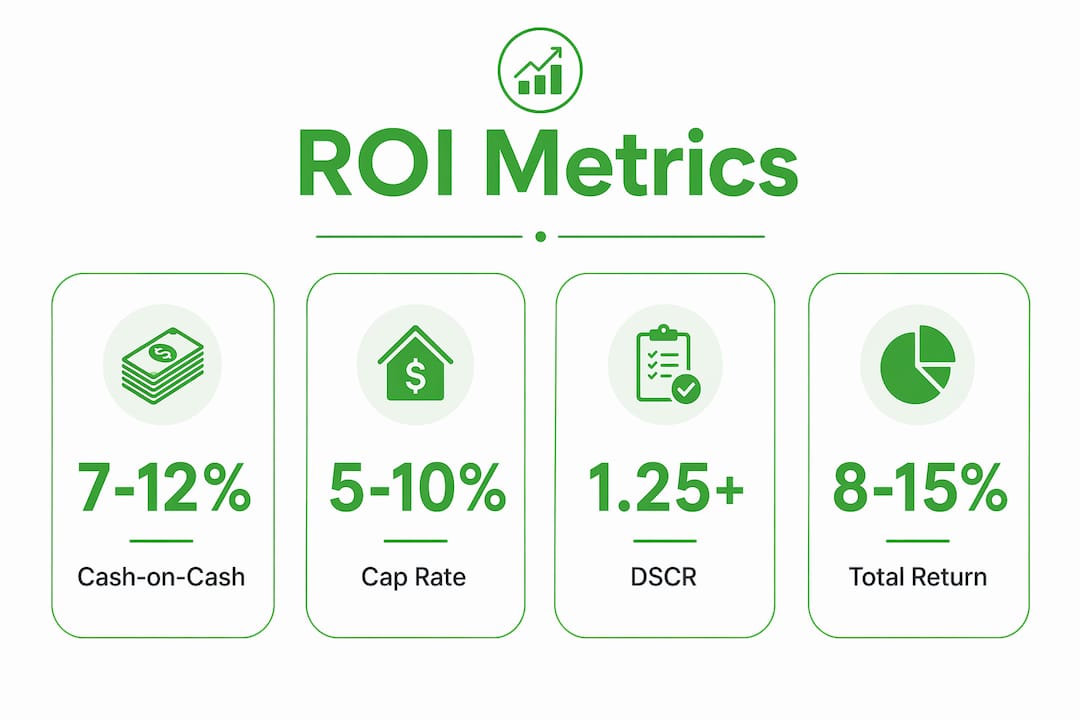
Cap rate measures a property's return independent of financing. The formula is NOI divided by the purchase price. Cap rate and cash-on-cash return are both essential metrics, but they answer different questions. Cap rate tells you how the asset performs on its own. A $200,000 property with $14,800 NOI carries a 7.4% cap rate. Typical cap rates run 5–10% in most markets, with higher rates signaling either better cash flow or higher risk.
Cash-on-cash return
Cash-on-cash return is the metric most landlords should prioritize when financing is involved. The formula is annual pre-tax cash flow divided by total cash invested. If you put $50,000 down and net $4,000 per year after mortgage payments, your cash-on-cash return is 8%. This metric captures the real drag of your loan, which cap rate completely ignores. Cap rate alone is misleading because it ignores leverage effects that directly affect what you actually earn.
IRR and GRM
Internal Rate of Return (IRR) measures capital efficiency across a multi-year hold. It accounts for the timing of every cash inflow and outflow, making it the most accurate metric for comparing two properties held over different periods. Gross Rent Multiplier (GRM) is a faster screening tool: purchase price divided by annual gross rent. A GRM under 10 often signals a worthwhile property to investigate further, but it should never replace a full analysis.
| Metric | Formula | Typical Range |
|---|---|---|
| Cap Rate | NOI ÷ Purchase Price | 5–10% |
| Cash-on-Cash Return | Annual Cash Flow ÷ Cash Invested | 8–12% target |
| NOI | Gross Income − Vacancy − Operating Expenses | Varies by market |
| IRR | Discounted multi-year cash flows | 10–15% target |
| GRM | Purchase Price ÷ Annual Gross Rent | Under 10 preferred |
Pro Tip: Calculate cash-on-cash return before you make an offer. If the number is below 6% at current mortgage rates, run a stress test at 10% vacancy before committing.
How to collect and estimate accurate income and expense data
Garbage in, garbage out. Your ROI analysis is only as good as the numbers you feed it.
Start with effective gross income (EGI). Take your projected annual rent and subtract a vacancy allowance. Most markets warrant a 5–8% vacancy assumption. Underestimating vacancy is one of the most common ways investors inflate projected returns before they buy.
Operating expenses to include in every analysis:
- Property taxes
- Landlord insurance
- Maintenance and repairs (budget 1% of property value per year as a baseline)
- Property management fees (typically 8–12% of collected rent)
- Utilities paid by the landlord
- HOA fees if applicable
- Advertising and tenant placement costs
Capital expenditures (CapEx) belong in a separate bucket. Roof replacements, HVAC systems, and appliances are not routine maintenance. Budget CapEx as a monthly reserve, typically $100–$200 per unit depending on property age and condition. Mixing CapEx with operating expenses distorts your NOI and makes your property look more profitable than it is.
The 50% rule states that operating expenses typically consume half of gross rental income. The 1% rule says monthly rent should equal at least 1% of the purchase price. Both rules are heuristics, not guarantees. Many high-growth urban markets fail the 1% rule entirely, yet still deliver strong total returns through appreciation. Use them to screen deals quickly, not to make final decisions.
Financing costs sit outside your NOI calculation but directly affect cash-on-cash return. Track your monthly mortgage payment, interest rate, loan term, and closing costs separately. The Debt Service Coverage Ratio (DSCR) measures how safely your NOI covers your debt payments. A DSCR of 1.20–1.25 or higher is the recommended safety buffer. A DSCR below 1.0 means the property cannot pay its own mortgage from rental income alone.
Pro Tip: After you close, track actual expenses monthly in a spreadsheet. Projected and actual expenses frequently diverge within the first year, and catching that gap early lets you adjust rents or cut costs before it compounds.
How does financing affect your full rental property return analysis?
Leverage is the most powerful and most dangerous tool in real estate investing. Used correctly, it multiplies your cash-on-cash return. Used carelessly, it turns a mediocre property into a cash-flow crisis.
Here is how to think through the full picture:
-
Model your leverage impact. A property with a 7% cap rate and no mortgage returns 7% on your full purchase price. Finance 75% of it at 7% interest, and your cash-on-cash return on the down payment could drop to 3–5% or turn negative in high-rate environments. Run both scenarios before you decide.
-
Include mortgage paydown as a return component. Every payment reduces your loan balance and builds equity. Over a 10-year hold, this equity buildup can add 2–4 percentage points to your total annualized return, even when monthly cash flow is thin.
-
Factor in appreciation conservatively. A 2–3% annual appreciation assumption is reasonable for most markets. Do not underwrite a deal that only works if appreciation hits 5% or more. Appreciation is a bonus, not a business plan.
-
Account for tax benefits. Depreciation, mortgage interest deductions, and ownership structure all affect your after-tax return. Tax planning significantly influences after-tax ROI and varies by tax bracket and entity type. A property with thin pre-tax cash flow can still deliver strong after-tax returns for investors in higher brackets. Consult a CPA who specializes in real estate before finalizing your analysis.
-
Run a stress test. Model what happens if vacancy rises to 15%, rents drop 10%, or interest rates increase on a variable loan. If the deal still survives those conditions, you have a real margin of safety. If it collapses, you are relying on luck.
A property with slightly negative monthly cash flow is not automatically a bad investment. When you add equity buildup, tax benefits, and appreciation, total ROI can still hit the 10–15% target. The key is knowing which components are driving the return and how reliable each one is. For a deeper look at how to set your entry price based on these projections, the guide on maximum allowable offers for rentals walks through the math precisely.
Pro Tip: Build your base case with conservative numbers, then run an optimistic scenario. If the gap between the two is enormous, the deal carries more uncertainty than the numbers suggest.
What mistakes do investors make when evaluating investment property ROI?
Most bad investment decisions trace back to a small set of recurring errors. Knowing them in advance is your best protection.
- Overestimating income. Investors often use asking rents rather than actual market rents. Pull comparable leases, not listings, to set your income assumption.
- Underestimating expenses. New investors routinely forget property management, CapEx reserves, and vacancy. These three items alone can swing your cash-on-cash return by 4–6 percentage points.
- Relying on one metric. A property with a strong cap rate can still deliver poor cash-on-cash return once financing is applied. Using cap rate alone is misleading without pairing it with cash-on-cash return and DSCR.
- Assuming zero repairs. Every property requires maintenance. Assuming otherwise is not optimism. It is a math error.
- Overleveraging. A DSCR below 1.20 leaves almost no cushion for vacancy or unexpected repairs. One bad month can force you to cover the mortgage from personal savings.
- Ignoring after-tax returns. Pre-tax and after-tax returns can differ materially depending on your bracket and ownership structure.
- Skipping ongoing review. ROI analysis does not end at closing. Reviewing actual versus projected performance annually tells you whether to hold, refinance, or sell.
"The biggest mistake I see is investors who run the numbers once before buying and never look at them again. A rental property is a business. Businesses track performance every month, not just at acquisition."
Ongoing tracking is not optional for serious investors. Platforms like Deal-zilla provide tools specifically built to track rental property performance metrics over time, so your analysis stays current rather than frozen at the purchase date.
Key Takeaways
Accurate rental property ROI analysis requires combining NOI, cap rate, cash-on-cash return, and DSCR into a single picture rather than relying on any one number alone.
| Point | Details |
|---|---|
| Use multiple metrics | Cap rate, cash-on-cash return, and IRR together give a complete return picture. |
| Target 8–12% cash-on-cash | This is the 2026 benchmark for a strong rental investment with financing. |
| Apply vacancy and CapEx | Budget 5–8% vacancy and separate CapEx reserves to avoid overstating NOI. |
| Maintain DSCR above 1.25 | A DSCR of 1.25 or higher protects cash flow against vacancies and rate changes. |
| Review ROI after purchase | Actual expenses often differ from projections; monthly tracking prevents surprises. |
What I have learned from years of rental property analysis
The investors I have seen succeed consistently share one habit: they treat every metric as a question, not an answer. A 9% cap rate does not mean "buy this property." It means "this property is worth analyzing further." That distinction matters more than any formula.
The most underrated return driver is active management. Active management and strategic rental models can increase rental income by 40–80% compared to passive, traditional approaches. That is not a marginal improvement. It is the difference between a mediocre investment and a great one. Investors who treat their rentals as passive income from day one often leave significant money on the table.
I am also cautious about appreciation assumptions. Every market cycle produces investors who underwrote deals at 5–6% annual appreciation and got burned when prices flattened. Conservative underwriting is not pessimism. It is professionalism. Build your return on cash flow and equity paydown. Let appreciation be the upside, not the thesis.
Finally, revisit your numbers every year. Markets shift, expenses change, and rents move. The investors who track cash flow improvement over time make better decisions about when to refinance, raise rents, or exit a position. The ones who set it and forget it often discover problems only when they try to sell.
— ARX
Deal-zilla's tools for smarter rental property decisions
Knowing the formulas is one thing. Running them accurately on real properties, with real market data, is where most investors need support.
Deal-zilla builds tools specifically for real estate investors who want to move beyond spreadsheet guesswork. The Deal-zilla platform includes a Deal Analyzer, BRRR Calculator, Rent Analyzer, and access to real Section 8 and HUD rate data. These tools let you input actual property figures and get reliable ROI projections fast. Whether you are analyzing your first rental or managing a growing portfolio, Deal-zilla gives you the data infrastructure to make decisions you can defend with numbers.
FAQ
What is a good ROI for a rental property in 2026?
A strong rental property targets 8–12% cash-on-cash return and 10–15% total annual return including appreciation and equity paydown. Cap rates typically fall between 5–10% depending on market and property type.
What is the difference between cap rate and cash-on-cash return?
Cap rate measures a property's return without financing; cash-on-cash return measures the actual return on your invested cash after mortgage payments. Cash-on-cash return is more useful when you are using a loan to purchase.
How do I calculate rental property ROI?
Start with NOI (gross income minus vacancy and operating expenses), then divide by purchase price for cap rate, or divide annual cash flow by cash invested for cash-on-cash return. Use both metrics together for a complete picture.
What is DSCR and why does it matter?
DSCR is NOI divided by annual debt service. A DSCR of 1.25 or higher means the property generates 25% more income than needed to cover the mortgage, providing a safety buffer against vacancies and unexpected costs.
How often should I review my rental property ROI?
Review actual versus projected performance at least once per year. Expenses and rents shift over time, and annual tracking lets you catch underperformance early and make informed decisions about refinancing, rent adjustments, or selling.