
Value a rental property by building a realistic income-and-expense model, then running multiple return metrics — NOI, cap rate, cash-on-cash, IRR — and stress-testing your assumptions before you make an offer. The core sequence: verify market rent, subtract vacancy and operating expenses to get Net Operating Income, divide NOI by a market cap rate to get an implied value, then layer in financing to see what the deal actually returns on your cash. Prioritize cash flow if you need income now; prioritize total return (appreciation plus equity paydown) if you can hold 7–10 years and refinance as rates move. Either way, gather every input in the next section before you touch a calculator.
Table of Contents
- What metrics actually tell you how to value a rental property?
- What inputs do you need before running a valuation model?
- Step-by-step: how to calculate rental property value with a worked example
- How do you estimate market rent and find comparable sales data?
- How does financing change the valuation picture?
- Do the 1% rule and 50% rule actually work?
- Which tools and calculators save the most time?
- What should you watch out for when underwriting a rental?
- How do tax implications and depreciation affect rental property valuation?
- Key Takeaways
- The current market rewards patience over optimism
- Deal-zilla runs the full analysis automatically
- Useful sources
What metrics actually tell you how to value a rental property?
A multi-metric approach is non-negotiable because each metric answers a different question. Here is what each one measures and when it matters.
Net Operating Income (NOI) is the foundation of every other metric. Formula: Effective Gross Income (EGI) minus all operating expenses, excluding debt service. A property with gross rent, typical vacancy, and operating expenses produces a specific Net Operating Income (NOI). NOI is the number lenders and appraisers use first.
Cap Rate converts NOI into a value estimate. Formula: NOI ÷ Purchase Price. A property generating NOI consistent with market conditions has a corresponding cap rate, which varies by asset class. Cap rate ignores financing entirely, which makes it the cleanest tool for comparing properties across markets and leverage structures. Market cap rates vary materially by submarket and property class, with lower rates for premium assets and higher rates for lower-tier assets. Always derive your cap rate from recent sales comps for the same asset class, not national averages.
Cash-on-Cash Return measures what your actual dollars earn. Formula: Annual pre-tax cash flow ÷ Total cash invested (down payment + closing costs + rehab). Cash-on-cash return measures the annual cash flow relative to cash invested, indicating if leverage amplifies returns. This is the metric that tells you whether leverage is helping or hurting.
IRR (Internal Rate of Return) is the preferred metric for multi-year comparisons because it accounts for the time value of money, mortgage paydown, appreciation, and exit costs. IRR captures monthly cash flow, mortgage amortization, and sale proceeds — making it the decisive number when comparing hold strategies. IRR reflects multi-year returns accounting for cash flow and appreciation; typical target ranges exist for residential rentals.
GRM (Gross Rent Multiplier) is a quick sanity check. Formula: Purchase Price ÷ Annual Gross Rent. GRM thresholds provide rough screening for rental property returns, with lower values indicating potentially better deals. It ignores expenses, so treat it as a screening filter, not a valuation tool.
DSCR (Debt Service Coverage Ratio) is what lenders care about. Formula: NOI ÷ Annual Debt Service. A property with $24,000 NOI and $18,000 in annual mortgage payments has a DSCR of 1.33. Lenders typically require a minimum Debt Service Coverage Ratio (DSCR) above a baseline to approve financing. Run this check early — if realistic rents and expenses produce a DSCR below that threshold, financing constraints will cap your offer price before your return targets do.
Pro Tip: Never underwrite a deal on a single metric. A strong cap rate with a negative cash-on-cash return means leverage is working against you. A positive cash-on-cash with a weak IRR means the long-term total return is thin. Run all six before you decide.
What inputs do you need before running a valuation model?
Garbage in, garbage out. Collect every number below before you open a spreadsheet or calculator. Missing one input — especially property tax or CapEx — routinely turns a "good deal" into a break-even or worse.
| Input Category | Specific Input | Where to Source It |
|---|---|---|
| Acquisition | Purchase price | MLS / offer price |
| Acquisition | After-repair value (ARV) | Comparable sales, appraiser |
| Acquisition | Closing costs | Lender estimate (typically 2–5%) |
| Acquisition | Repair / rehab costs | Contractor bids |
| Income | Monthly market rent | Zillow Rent Zestimate, Rentometer, local PM quotes |
| Income | Other income (parking, laundry, storage) | Seller disclosure, market comps |
| Income | Vacancy rate | Local market data (typically 5–10%) |
| Expenses | Property tax | County assessor / tax bill |
| Expenses | Insurance (landlord policy) | Insurance quotes |
| Expenses | HOA fees | HOA disclosure |
| Expenses | Property management fee | PM company quotes (typically 8–12% of rent) |
| Expenses | Maintenance (routine) | 8–12% of EGI or $1/sq ft/yr |
| Expenses | CapEx reserves | 5–10% of EGI; higher for older assets |
| Expenses | Utilities paid by owner | Utility bills / seller disclosure |
| Financing | Loan amount or LTV | Lender prequal |
| Financing | Interest rate | Lender quote |
| Financing | Loan term | Lender quote (typically 30 years) |
| Exit | Holding period | Investment thesis (5, 7, or 10 years) |
| Exit | Expected annual appreciation | Local market data, conservative estimate |
| Exit | Cost to sell | Typically 6–8% of sale price |
A few inputs deserve extra attention. Property tax is the most commonly underestimated line item — always pull the actual tax bill or county assessor record, not the seller's estimate. CapEx reserves cover big-ticket replacements (roof, HVAC, water heater) and should be higher for properties built before 1990. Insurance for a rental runs 15–25% more than owner-occupied coverage due to liability exposure, so get a landlord-specific quote.
Step-by-step: how to calculate rental property value with a worked example
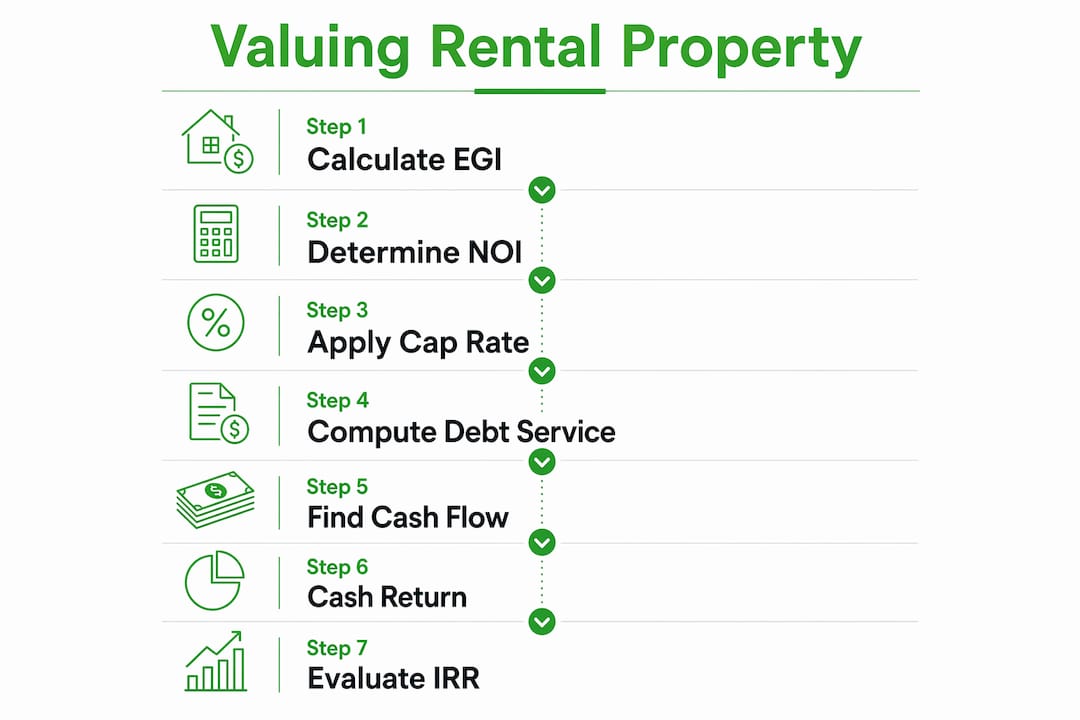
The calculation order matters. Follow this sequence every time.
Step 1 — Effective Gross Income (EGI): Monthly Rent × 12 × (1 − Vacancy Rate) + Other Annual Income

Step 2 — NOI: EGI − All Operating Expenses (taxes, insurance, management, maintenance, CapEx, HOA, utilities)
Step 3 — Cap-Rate Implied Value: NOI ÷ Market Cap Rate
Step 4 — Annual Debt Service: Monthly P&I × 12 (use a mortgage amortization formula or calculator)
Step 5 — Annual Cash Flow: NOI − Annual Debt Service
Step 6 — Cash-on-Cash Return: Annual Cash Flow ÷ Total Cash Invested
Step 7 — IRR: Model monthly cash flows across your hold period, add net sale proceeds in the final period, and solve for the discount rate that makes NPV = 0. Use Excel's =IRR() or Google Sheets' =IRR() function on a column of annual cash flows including the initial investment as a negative number.
Worked example: Memphis single-family rental
Inputs include purchase price, typical down payment, mortgage terms, monthly rent, and estimated expenses such as vacancy, management fees, property tax, insurance, maintenance, CapEx, and closing costs.
EGI: $1,550 × 12 × 0.92 = $17,112
NOI: $17,112 − ($2,730 + $1,500 + $1,860 + $1,860) = $9,162
Cap rate calculation produces a value typical for the local market and financing environment.
Annual debt service: $1,023/month × 12 = $12,276
Annual cash flow results from subtracting debt service from NOI, which may be negative in current high-rate conditions.
Total cash invested: $48,750 + $4,250 = $53,000
Cash-on-cash return reflects actual cash earnings relative to investment, which can be negative with high financing costs.
Debt Service Coverage Ratio below lender minimum thresholds indicates financing constraints for the deal.
At 7.5% financing, this deal is cash-flow negative. The income approach confirms the value is supported by NOI, but leverage is working against the investor at current rates. The deal makes sense only if you hold for appreciation and equity paydown — a 10-year IRR in the 8–10% range is plausible with conservative 3% annual appreciation — or if you refinance when rates drop.
Sensitivity check: A 1-point drop in cap rate (from 4.7% to 3.7%) would imply a value of $247,000 for the same NOI — a $52,000 swing. A 0.5% rate reduction on the mortgage (7.5% to 7.0%) saves roughly $45/month in debt service, improving annual cash flow by $540. Test both directions before you commit to an offer price.
How do you estimate market rent and find comparable sales data?
Rent is the single input that most changes your NOI, which means it most changes your valuation. Getting it wrong by even 5% can flip a deal from positive to negative cash flow.
Start with active rental listings for comparable units in the same neighborhood. Look for properties with the same number of bedrooms and bathrooms, similar square footage, and comparable condition. Zillow's Rent Zestimate gives a quick automated estimate, and Rentometer lets you cross-check against local rental comps by zip code. Neither tool replaces a call to a local property manager, who can tell you what units are actually leasing for — not just what landlords are asking.
When adjusting comps, account for:
- Condition and finishes: Updated kitchens and baths can command $50–150/month more in most mid-tier markets.
- Included utilities: A unit where the landlord pays water reduces net rent by the utility cost.
- Lease terms: Month-to-month leases often carry a premium; long-term leases may be slightly below market.
- Parking and storage: Dedicated parking in urban markets can add $50–200/month.
For comparable rental properties, pull at least three to five active or recently leased comps within a half-mile radius, then weight toward the most recent and most similar. Average the adjusted rents and apply a conservative 5–8% vacancy rate to get your effective market rent.
Deriving a market cap rate follows the same logic. Pull recent investment-property sales in the same submarket, calculate the NOI each property was generating at sale, and divide by the sale price. Three to five comps give you a defensible cap-rate range. If sales data is thin, published market reports from CBRE, Marcus & Millichap, or local commercial brokers provide submarket cap-rate benchmarks.
Pro Tip: Cross-check your rent estimate against the 1% rule as a sanity filter. If your market rent is well below 1% of the purchase price, you need a strong appreciation thesis or a plan to force value — not just a hope that rents will rise.
How does financing change the valuation picture?
Cap rate is an unlevered metric. It tells you what the property returns on its full value, regardless of how you finance it. Cash-on-cash and IRR are where financing shows up, and the difference can be dramatic.
Consider three scenarios on a $300,000 property with $18,000 NOI (6% cap rate):
All-cash: Cash-on-cash = 6% (equals cap rate). No debt service risk.
75% LTV at 6.5% (30-year): Monthly P&I ≈ $1,422; annual debt service ≈ $17,064. Annual cash flow = $18,000 − $17,064 = $936. Cash-on-cash = $936 ÷ $75,000 = 1.2%. Leverage barely helps.
75% LTV at 7.5% (30-year): Higher mortgage payments at increased rates can result in negative leverage, worsening cash-on-cash returns compared to all-cash purchases.
This is the core problem in the current rate environment. When your mortgage rate exceeds your cap rate, leverage hurts cash flow rather than amplifying it. A Debt Service Coverage Ratio below typical lender standards usually disqualifies conventional loans.
Pro Tip: Low initial cash-on-cash can still make sense when IRR over a 10-year hold is strong — if appreciation and principal paydown push total return above 10%, accepting a small monthly subsidy in years 1–3 is a defensible strategy. But only if your reserves can cover the shortfall without stress. Never count on appreciation to bail out a deal that fails on cash flow from day one.
For a deeper look at cash-on-cash return mechanics and how leverage shifts the math, the Deal-zilla guide walks through multiple scenarios with worked numbers.
Do the 1% rule and 50% rule actually work?
They work as triage filters. They fail as valuation tools.
The 1% rule says monthly rent should equal at least 1% of the purchase price. A $200,000 property should rent for $2,000/month or more. Properties that clear this threshold tend to generate positive cash flow after expenses. Those that fall short — say, a $400,000 property renting for $2,200/month (0.55%) — almost certainly cash-flow negative at current rates.
The 50% rule estimates that operating expenses consume roughly 50% of gross rent, leaving the other 50% to cover debt service. A property renting for $2,000/month has roughly $1,000 available for the mortgage. At 7.5% on a 30-year loan, $1,000/month services about $143,000 in debt — meaning the all-in purchase price should be around $190,000 for the deal to work. The 55% variant is more conservative and more realistic for older properties.
GRM threshold: A GRM under 10 is generally favorable; above 15 is a warning sign. Calculate it as Purchase Price ÷ Annual Gross Rent.
Where these rules break down:
- Coastal and high-price markets (Los Angeles, New York, Seattle): the 1% rule is nearly impossible to hit. Most investors there rely on appreciation, not cash flow.
- High-HOA properties: A $500/month HOA fee alone can consume the entire margin the 50% rule leaves for debt service.
- Older assets with deferred maintenance: CapEx can spike well above the 50% rule's implied expense budget.
- Short-term rentals: Gross revenue looks strong, but platform fees, furnishing costs, and higher vacancy make the 50% rule dangerously optimistic.
Use these rules to screen deals in 30 seconds. Once a property passes the screen, replace the rules with a full NOI-based model. A deal that barely clears the 1% rule at current rates may still be cash-flow negative — run the numbers.
Which tools and calculators save the most time?
The right tool depends on where you are in the underwriting process.
Quick rent lookups: Zillow Rent Zestimate and Rentometer are the fastest starting points for estimating market rent. Both use automated models and should be cross-checked against active listings and local PM quotes before you rely on them for underwriting.
Full income-approach calculators: Calculator.net's rental property calculator handles the complete input set — purchase price, financing, closing costs, repair costs, monthly rent, vacancy, management fees, taxes, insurance, HOA, maintenance, and appreciation assumptions. It outputs NOI, cap rate, cash-on-cash, and IRR across a user-defined hold period. CalcFi's rental property ROI calculator produces cap rate, cash-on-cash, DSCR, and projected IRR with a DSCR flag when the ratio falls below 1.25. Both are free and require no account.
Rent vs. sell analysis: The National Association of Residential Property Managers (NARPM) offers a rent vs. sell calculator that helps owners compare the financial outcome of holding versus liquidating. Useful when you already own a property and are deciding whether to convert it to a rental.
Spreadsheet models: For serious underwriting, a custom Excel or Google Sheets model beats any online calculator because you control every assumption and can run sensitivity scenarios instantly. Build a column for each year of your hold period, model rent growth, expense inflation, and a sale in the final year, then use =IRR() on the annual cash flow column.
Recommended workflow: quick screen with the 1% rule → rent estimate via Zillow/Rentometer + PM quote → full model in Calculator.net or CalcFi → custom spreadsheet for sensitivity scenarios → lender pre-underwrite to confirm DSCR.
What should you watch out for when underwriting a rental?
The KPIs that matter most during underwriting are the ones sellers most often present favorably. Here is what to verify independently.
Underwriting best practices:
- Use 8–10% vacancy, not the seller's "always rented" claim.
- Budget CapEx at 5–10% of EGI; push to 10–12% for properties over 20 years old.
- Pull the actual tax bill from the county assessor — assessed value often resets at sale.
- Get a landlord insurance quote before closing, not after.
- Include a leasing-fee reserve (half to one month's rent per tenant turnover).
Red flags that should slow or stop a purchase:
- Seller-provided rent rolls that show rents materially above active market comps.
- Deferred maintenance visible during inspection (aging roof, original HVAC, foundation cracks) that signals a CapEx spike in years 1–3.
- DSCR below 1.0 at realistic rents and current financing — the property cannot service its own debt.
- Rapidly declining local demand indicators: rising days-on-market for rentals, population outflow, major employer departures.
Stress-test your model by running a downside scenario: vacancy at 12%, rent 5% below your estimate, and CapEx 50% above budget. If the deal still produces an acceptable IRR under those conditions, you have a margin of safety. If it collapses, you are underwriting to perfection — and perfection rarely shows up in real estate.
How do tax implications and depreciation affect rental property valuation?
Depreciation is one of the most powerful — and most overlooked — advantages of owning rental real estate. The IRS allows residential rental property to be depreciated over 27.5 years on a straight-line basis, applied to the building value (not the land). On a $195,000 property where the building is assessed at $155,000, annual depreciation is roughly $5,636. That deduction reduces your taxable rental income without reducing your actual cash flow.
Rental income is generally taxable as ordinary income, but deductible expenses include mortgage interest, property taxes, insurance, repairs, management fees, utilities paid by the owner, and depreciation. For many investors in mid-range tax brackets, depreciation alone can shelter most or all of the property's net rental income in the early years of ownership.
Renovation costs are not immediately deductible the way repairs are, but they increase your cost basis and can be depreciated over time. A higher cost basis also reduces your taxable gain when you sell. Cost segregation studies can accelerate depreciation on certain components (appliances, flooring, landscaping) into shorter recovery periods — 5, 7, or 15 years — which front-loads the tax benefit and improves after-tax IRR.
When you sell, depreciation recapture is taxed at a maximum federal rate of 25%, and any remaining gain is taxed at long-term capital gains rates (0%, 15%, or 20% depending on income). A 1031 exchange lets you defer both taxes by rolling proceeds into a like-kind property. Factor these exit-tax costs into your IRR model — selling costs plus depreciation recapture can consume 8–12% of gross sale proceeds on a fully depreciated property.
The practical takeaway: always model after-tax cash flow and after-tax IRR, not just pre-tax numbers. A deal with a mediocre pre-tax return can look significantly better once depreciation and deductions are applied. Consult a CPA familiar with real estate before finalizing your underwriting assumptions.
This article is general information, not tax or legal advice. Confirm current IRS rules and your specific tax situation with a qualified CPA or tax attorney.
Key Takeaways
A defensible rental property valuation requires NOI, cap rate, cash-on-cash return, GRM, DSCR, and total return — run in sequence, stress-tested with sensitivity scenarios, and adjusted for financing and tax effects before you make an offer.
| Point | Details |
|---|---|
| Run the full metric stack | NOI, cap rate, cash-on-cash return, GRM, DSCR, and IRR each answer a different question; no single metric is enough. |
| Cap rate sets value; financing changes returns | A 6% cap rate with 7.5% debt produces negative leverage; model cash-on-cash and IRR after financing. |
| Verify rent independently | Use Zillow Rent Zestimate, Rentometer, and a local PM quote — never rely on the seller's rent figure alone. |
| Depreciation improves after-tax returns | Annual depreciation on the building shelters taxable income without reducing cash flow; model it in your IRR. |
| Deal-zilla automates the analysis | Deal-zilla's Deal Analyzer and Rent Analyzer run the full input set for U.S. properties, including DSCR and IRR projections. |
The current market rewards patience over optimism
The conventional wisdom in real estate investing has always leaned toward action: find a deal, run the numbers quickly, make an offer. In a low-rate environment, that bias toward speed made sense — cheap debt covered a lot of underwriting sins. At current financing levels, it does not.
What I keep coming back to is how many investors are still using pre-2022 mental models. They see a 5% cap rate and think "decent deal," without running what that cap rate actually produces after 7.5% debt service. The answer, as the Memphis example above shows, is often a DSCR under 1.0 and a cash-on-cash return that is negative from day one. That is not a bad deal to hold through — if you have the reserves and the conviction on appreciation. It is a catastrophic deal if you are counting on monthly cash flow to cover your own expenses.
The investors doing well right now are the ones who have tightened their underwriting to match the financing reality, not the rate environment of three years ago. They are running rental property ROI analysis with conservative vacancy, realistic CapEx, and a 10-year hold assumption. They are also paying attention to inflation's dual role: rental real estate can hedge inflation over the long term as rents and values rise, but elevated mortgage rates can offset that benefit in the short term. The long-hold thesis is sound. The "buy now, cash-flow immediately" thesis needs a much better deal than most markets are currently offering.
Deal-zilla runs the full analysis automatically
Running every metric manually — NOI, cap rate, cash-on-cash, DSCR, IRR, sensitivity scenarios — takes time, and one wrong formula in a spreadsheet can send you toward the wrong offer price. Deal-zilla's Deal Analyzer handles the full input set for U.S. rental properties: enter your purchase price, financing terms, rent estimate, and expense assumptions, and it outputs cap rate, NOI, cash-on-cash, DSCR, and projected IRR across your hold period. The Rent Analyzer cross-checks your rent input against real Section 8 HUD rates and market data, so you are not underwriting to an optimistic number.

Deal-zilla also includes a BRRR calculator for value-add strategies and a Section 8 Investment Analyzer for investors targeting government-assisted housing. Coverage is U.S. markets. Other tools exist, and the manual spreadsheet approach covered in this guide works well — but if you want to run a defensible analysis in minutes rather than hours, start with Deal-zilla's analyzer and use the worked example above to verify the outputs make sense.
Useful sources
| Source | What It Covers | Coverage Notes |
|---|---|---|
| CalcFi Rental Property ROI Calculator | Cap rate, cash-on-cash, DSCR, projected IRR; flags DSCR below 1.25 | U.S. properties; free, no account required |
| Calculator.net Rental Property Calculator | Full input set including closing costs, appreciation, and annual increases; outputs NOI, IRR, cash-on-cash | U.S. focused; good for multi-year projections |
| Investopedia: 5 Ways to Value a Rental Property | Overview of SCA, income approach, GRM, CAPM, and cost approach | Conceptual guide; U.S. context |
| Fidelity: Investment Property Guide | Tax advantages, depreciation, inflation hedging, and risk factors | General U.S. investor education |
| YellowDeed: 8 Metrics Every Investor Needs | Multi-metric underwriting framework; cap rate, NOI, cash-on-cash, IRR | U.S. residential focus |
| NARPM Rent vs. Sell Calculator | Helps existing owners compare holding versus selling financially | U.S. residential property managers |
| EchoPM: Landlord KPIs for 2026 | NOI, vacancy, CapEx, turnover metrics for ongoing portfolio monitoring | U.S. landlords and property managers |
| All Property Management: 2026 Investment Outlook | Market commentary on financing headwinds and conservative underwriting | U.S. market; 2026 context |